

From SharePoint Lists to Live AI Dashboards with Microsoft 365 Copilot
Introduction
For years, SharePoint Lists have been a practical way to manage structured business data such as project portfolios, service requests, risks, assets, training registrations, purchase requests, events, and operational trackers.
However, presenting that information visually has usually required an additional reporting layer. A team might create a Power BI report, build a Power Apps application, customize SharePoint views, develop an SPFx solution, or periodically export the information to Excel.
Copilot in SharePoint introduces another interesting option: ask Copilot to turn the data into an interactive dashboard using natural language.
Microsoft describes Copilot in SharePoint as an experience that can use natural language to create SharePoint sites, pages, lists, libraries, Office files, and interactive reports. In August 2026, Microsoft specifically highlighted live dashboards connected to lists and files as one of the new Copilot in SharePoint capabilities.
This changes the idea of AI-generated reporting.
Instead of asking AI:
“Analyze this list and give me a summary.”
we can ask:
“Create an interactive executive dashboard for this Project Portfolio list. Include KPI cards for total projects, active projects, projects at risk and total budget. Add charts by department and project status, and provide filters for department, owner and status.”
Copilot can generate an interactive HTML experience based on the underlying business data.
More importantly, when the dashboard is connected to a SharePoint List, it can retrieve the current list data when the dashboard is loaded or refreshed. It is therefore different from an AI-generated report containing a snapshot of the data.
This makes SharePoint Lists much more interesting as lightweight data sources for AI-generated business dashboards.
What Is a Copilot-Generated SharePoint Dashboard?
At its simplest, the dashboard is an HTML file generated by Copilot and stored within SharePoint.
The HTML can contain components such as:
- KPI cards
- Bar charts
- Pie or doughnut charts
- Line charts
- Tables
- Search boxes
- Dropdown filters
- Date filters
- Drill-down experiences
- Detail popups
- Buttons
- Links to SharePoint records
- Responsive layouts
The dashboard can then be opened directly or embedded into a SharePoint page.
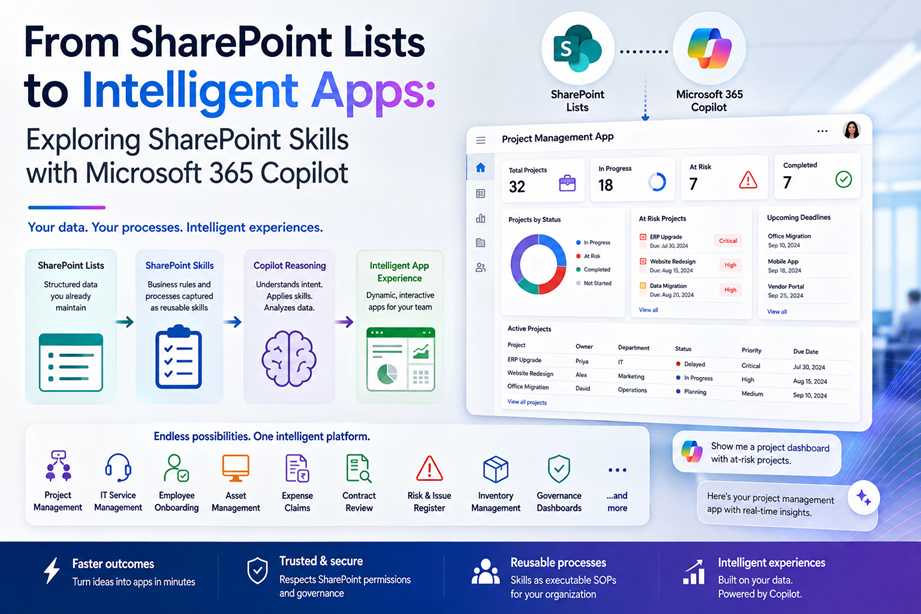
A useful way of thinking about the architecture is:
Business Data → Copilot → Interactive HTML Dashboard → SharePoint Page/User
But there is an important distinction.
Copilot is used primarily to build the experience. The dashboard can then work against the SharePoint data source.
That means the AI does not necessarily need to regenerate the entire report every time a list item changes.
Static AI Reports vs. Live AI Dashboards
This distinction is one of the most important aspects of the capability.
Suppose we have a SharePoint List containing:
| Project | Department | Status | Budget | Risk |
|---|---|---|---|---|
| ERP Upgrade | IT | In Progress | $250,000 | Medium |
| Office Expansion | Facilities | At Risk | $120,000 | High |
| CRM Migration | Sales | In Progress | $180,000 | Low |
| Security Program | IT | Completed | $90,000 | Low |
We could ask an AI assistant to analyze the information and create an HTML report.
The result might contain:
Total Projects: 4
Total Budget: $640,000
Projects at Risk: 1
That looks useful.
But if someone later adds another project to the list, the HTML report may still show four projects because the values were embedded into the generated file.
That is a static AI-generated report.
A live dashboard works differently.
The dashboard retrieves information from the SharePoint List when it runs. If the list changes from four projects to five, refreshing the dashboard can reflect the fifth project without asking Copilot to recreate the dashboard. The dashboard then reflected the updated category counts without requiring a new HTML file.
That difference turns the output from an AI artifact into something closer to a lightweight business application.
The Basic Architecture
Conceptually, the solution looks like this:
             SharePoint
                 |
        +--------+---------+
        |                  |
 SharePoint List       Excel / CSV
        |                  |
        +--------+---------+
                 |
                 v
        Copilot in SharePoint
                 |
        Natural-language prompt
                 |
                 v
       Generated HTML Dashboard
                 |
        +--------+---------+
        |                  |
     Charts             Filters
     KPIs               Search
     Tables             Drill-down
        |                  |
        +--------+---------+
                 |
                 v
          SharePoint Page
                 |
                 v
              Users
With a SharePoint List as the data source, the generated dashboard can access the list data rather than simply embedding a snapshot of the records.
The list therefore remains the system of record, while the generated HTML becomes the presentation layer.
Why SharePoint Lists Are Particularly Interesting
Copilot can work with files, but SharePoint Lists provide several advantages for operational business scenarios.
A SharePoint List already provides structured columns, data types, filtering, version history, item-level records, permissions, forms, automation possibilities, and Microsoft 365 integration.
For example, consider a Project Portfolio list containing:
- Project Name
- Department
- Project Manager
- Start Date
- End Date
- Status
- Budget
- Actual Cost
- Risk Level
- Completion %
- Business Sponsor
The list handles the business data.
Copilot can then create the visualization layer.
This leads to an interesting pattern:
SharePoint List = lightweight business database
Copilot = experience generator
HTML = interactive visualization layer
SharePoint Page = publishing layer
That combination can cover many lightweight departmental reporting requirements without immediately starting a traditional development project.
Creating a Project Portfolio from a SharePoint List
The process can be surprisingly simple.
In this example, we will create a Project Portfolio SharePoint List, add more than 100 sample projects, and then use Copilot in SharePoint to generate an interactive management dashboard.
The dashboard will help leadership answer questions such as:
- How many projects are currently active?
- How many projects are at risk?
- What is the total approved budget?
- Which departments have the highest project spend?
- Which projects are overdue?
- Which project managers own the most high-risk projects?
- How much budget has already been consumed?
- Which projects require immediate attention?
The complete flow is:
SharePoint List
      ↓
100+ Project Records
      ↓
Copilot in SharePoint
      ↓
Natural-Language Prompts
      ↓
Generated Interactive HTML Dashboard
      ↓
SharePoint Page
      ↓
Leadership / PMO Users
Scenario: Enterprise Project Portfolio Dashboard
Assume an organization maintains its projects in a SharePoint List called:
Enterprise Project Portfolio
Different departments use the list to track their projects.
The departments include:
- IT
- Finance
- HR
- Operations
- Sales
- Marketing
- Procurement
- Legal
- Facilities
- Customer Service
The PMO wants a single dashboard showing the overall health of the portfolio.
Instead of manually creating charts or immediately developing a Power BI report, we will ask Copilot to build the initial dashboard.
Step 1: Create the SharePoint List
Create a new SharePoint List named:
Enterprise Project Portfolio
The default Title column can be renamed to:
Project Name
Create the following columns.
| Column | Type | Example | Purpose |
|---|---|---|---|
| Project Name | Single line of text | ERP Modernization | Project title |
| Project ID | Single line of text | PRJ-0001 | Unique business identifier |
| Department | Choice | IT | Owning department |
| Project Manager | Person or Group | Alex Wilber | Project owner |
| Sponsor | Person or Group | Megan Bowen | Executive sponsor |
| Status | Choice | In Progress | Current project state |
| Priority | Choice | High | Business priority |
| Risk Level | Choice | Medium | Overall project risk |
| Start Date | Date | 01-Jan-2026 | Planned start |
| Target Date | Date | 30-Sep-2026 | Planned completion |
| Completion % | Number | 65 | Progress percentage |
| Approved Budget | Currency | 250000 | Approved project budget |
| Actual Spend | Currency | 180000 | Spend to date |
| Business Value | Choice | High | Expected business value |
| Health | Choice | Amber | Overall project health |
| Region | Choice | APAC | Primary region |
| Project Type | Choice | Transformation | Project category |
| Description | Multiple lines of text | Modernize ERP platform | Short project description |
Choice Column Values
Configure the choice columns with consistent values.
Department
IT
Finance
HR
Operations
Sales
Marketing
Procurement
Legal
Facilities
Customer Service
Status
Not Started
In Progress
On Hold
Completed
Cancelled
Priority
Low
Medium
High
Critical
Risk Level
Low
Medium
High
Critical
Business Value
Low
Medium
High
Strategic
Health
Green
Amber
Red
Region
Global
APAC
EMEA
North America
Latin America
Project Type
Transformation
Infrastructure
Compliance
Application
Automation
Customer Experience
Data & AI
Security
Cost Optimization
Business Improvement
Step 2: Add Useful Calculated Information
You do not necessarily need calculated columns because the dashboard can perform calculations itself.
However, the following logic is useful when designing the dashboard.
Budget Variance
Approved Budget - Actual Spend
Budget Utilization
Actual Spend / Approved Budget × 100
For example:
Approved Budget = $500,000
Actual Spend    = $350,000

Budget Utilization = 70%
Overdue Project
A project should be treated as overdue when:
Target Date < Today
AND
Status <> Completed
AND
Status <> Cancelled
Attention Required
A project could be considered as requiring management attention when:
Health = Red
OR
Risk Level = Critical
OR
Project is overdue
OR
Actual Spend > Approved Budget
These rules can be included directly in your Copilot prompt.
Step 3: Add Sample Data
The following dataset contains 120 sample projects.
It is deliberately varied so the dashboard produces meaningful charts, filters and KPIs.
You can save this as CSV and import it into SharePoint.
ProjectID,ProjectName,Department,Status,Priority,RiskLevel,StartDate,TargetDate,CompletionPercent,ApprovedBudget,ActualSpend,BusinessValue,Health,Region,ProjectType
PRJ-0001,ERP Modernization,IT,In Progress,Critical,High,2026-01-05,2026-12-15,62,1800000,1210000,Strategic,Amber,Global,Transformation
PRJ-0002,Finance Process Automation,Finance,In Progress,High,Medium,2026-02-01,2026-09-30,72,450000,298000,High,Green,Global,Automation
PRJ-0003,Employee Onboarding Refresh,HR,Completed,Medium,Low,2025-10-10,2026-03-15,100,150000,142000,Medium,Green,Global,Business Improvement
PRJ-0004,Warehouse Optimization,Operations,In Progress,High,High,2026-01-15,2026-10-31,58,820000,565000,High,Amber,APAC,Cost Optimization
PRJ-0005,CRM Modernization,Sales,In Progress,Critical,Medium,2026-03-01,2027-01-31,45,1250000,530000,Strategic,Green,Global,Application
PRJ-0006,Digital Campaign Platform,Marketing,Completed,Medium,Low,2025-11-01,2026-04-30,100,320000,305000,High,Green,EMEA,Application
PRJ-0007,Supplier Portal,Procurement,In Progress,High,Medium,2026-02-10,2026-11-15,55,590000,335000,High,Green,Global,Application
PRJ-0008,Contract Lifecycle Management,Legal,In Progress,High,High,2026-01-20,2026-08-15,88,420000,405000,High,Red,Global,Application
PRJ-0009,Smart Office Rollout,Facilities,On Hold,Medium,Medium,2026-04-01,2026-12-20,25,380000,115000,Medium,Amber,APAC,Infrastructure
PRJ-0010,Customer Self Service Portal,Customer Service,In Progress,Critical,High,2026-01-10,2026-09-15,76,750000,612000,Strategic,Amber,Global,Customer Experience
PRJ-0011,Zero Trust Phase 2,IT,In Progress,Critical,Critical,2026-02-01,2026-11-30,51,980000,640000,Strategic,Red,Global,Security
PRJ-0012,Treasury Dashboard,Finance,Completed,Medium,Low,2025-09-01,2026-02-28,100,210000,198000,High,Green,Global,Data & AI
PRJ-0013,Learning Experience Platform,HR,In Progress,High,Medium,2026-03-15,2026-12-31,48,610000,312000,High,Green,Global,Transformation
PRJ-0014,Fleet Maintenance Analytics,Operations,In Progress,High,High,2026-01-05,2026-08-01,91,475000,468000,Strategic,Red,EMEA,Data & AI
PRJ-0015,Sales Forecasting AI,Sales,In Progress,High,Medium,2026-04-01,2026-12-10,42,525000,211000,Strategic,Green,Global,Data & AI
PRJ-0016,Brand Refresh 2026,Marketing,Completed,High,Low,2025-12-01,2026-06-30,100,290000,278000,High,Green,Global,Business Improvement
PRJ-0017,Strategic Sourcing Platform,Procurement,Not Started,Medium,Medium,2026-09-15,2027-04-30,0,700000,0,High,Green,Global,Transformation
PRJ-0018,Regulatory Compliance Hub,Legal,In Progress,Critical,High,2026-02-01,2026-10-15,65,510000,386000,Strategic,Amber,EMEA,Compliance
PRJ-0019,Energy Monitoring Program,Facilities,In Progress,Medium,Low,2026-01-15,2026-09-30,80,340000,225000,High,Green,APAC,Cost Optimization
PRJ-0020,Contact Center AI Assistant,Customer Service,In Progress,Critical,High,2026-03-01,2026-11-30,52,880000,492000,Strategic,Amber,Global,Data & AI
PRJ-0021,Cloud Migration Wave 4,IT,In Progress,Critical,Medium,2026-01-01,2026-10-30,68,1400000,905000,Strategic,Green,Global,Infrastructure
PRJ-0022,Expense Management Upgrade,Finance,In Progress,Medium,Low,2026-04-01,2026-09-15,70,280000,177000,Medium,Green,Global,Application
PRJ-0023,Skills Taxonomy Program,HR,In Progress,Medium,Medium,2026-03-01,2026-10-30,55,225000,134000,High,Amber,Global,Business Improvement
PRJ-0024,Distribution Network Redesign,Operations,Not Started,High,Medium,2026-10-01,2027-06-30,0,1350000,0,Strategic,Green,APAC,Transformation
PRJ-0025,Partner Sales Portal,Sales,In Progress,High,High,2026-02-01,2026-09-01,81,650000,598000,High,Red,EMEA,Application
PRJ-0026,Customer Insights Platform,Marketing,In Progress,High,Medium,2026-02-15,2026-11-30,54,720000,375000,Strategic,Green,Global,Data & AI
PRJ-0027,Vendor Risk Assessment,Procurement,Completed,Medium,Low,2025-12-01,2026-05-31,100,195000,188000,High,Green,Global,Compliance
PRJ-0028,Data Privacy Automation,Legal,In Progress,Critical,High,2026-03-01,2026-12-15,47,680000,345000,Strategic,Amber,Global,Automation
PRJ-0029,Head Office Renovation,Facilities,In Progress,High,Medium,2026-01-15,2026-10-31,61,970000,655000,Medium,Amber,EMEA,Infrastructure
PRJ-0030,Knowledge Management Portal,Customer Service,Completed,High,Low,2025-10-01,2026-06-01,100,440000,421000,High,Green,Global,Customer Experience
PRJ-0031,Microsoft 365 Governance,IT,In Progress,High,Medium,2026-04-01,2026-12-20,46,390000,172000,High,Green,Global,Compliance
PRJ-0032,Financial Close Automation,Finance,In Progress,High,High,2026-01-10,2026-08-20,86,360000,351000,High,Red,Global,Automation
PRJ-0033,Performance Management Refresh,HR,In Progress,Medium,Low,2026-05-01,2026-11-15,35,190000,74000,Medium,Green,Global,Business Improvement
PRJ-0034,Route Optimization AI,Operations,In Progress,Critical,High,2026-02-01,2026-12-01,49,920000,485000,Strategic,Amber,Global,Data & AI
PRJ-0035,Sales Territory Redesign,Sales,Completed,Medium,Low,2025-11-10,2026-05-15,100,175000,162000,Medium,Green,North America,Business Improvement
PRJ-0036,Marketing Data Hub,Marketing,In Progress,High,Medium,2026-01-10,2026-09-30,73,540000,391000,High,Green,Global,Data & AI
PRJ-0037,Procurement Analytics,Procurement,In Progress,Medium,Low,2026-05-01,2026-12-31,31,310000,97000,High,Green,Global,Data & AI
PRJ-0038,Legal Matter Management,Legal,On Hold,High,High,2026-01-05,2026-11-30,37,470000,214000,High,Red,Global,Application
PRJ-0039,Building Access Upgrade,Facilities,Completed,Medium,Low,2025-08-01,2026-03-30,100,255000,248000,Medium,Green,APAC,Security
PRJ-0040,Voice Analytics,Customer Service,In Progress,High,Medium,2026-03-15,2026-10-31,59,480000,284000,High,Amber,Global,Data & AI
PRJ-0041,Identity Governance Upgrade,IT,In Progress,Critical,High,2026-03-01,2026-09-20,78,620000,558000,Strategic,Amber,Global,Security
PRJ-0042,Budget Planning Transformation,Finance,Not Started,High,Low,2026-10-01,2027-03-31,0,525000,0,High,Green,Global,Transformation
PRJ-0043,Employee Listening Platform,HR,Completed,Medium,Low,2025-12-01,2026-05-01,100,260000,249000,Medium,Green,Global,Application
PRJ-0044,Port Operations Dashboard,Operations,In Progress,High,Medium,2026-04-15,2026-12-31,39,460000,177000,High,Green,APAC,Data & AI
PRJ-0045,Lead Qualification AI,Sales,In Progress,High,High,2026-03-01,2026-09-10,74,390000,356000,Strategic,Red,Global,Data & AI
PRJ-0046,Social Listening Platform,Marketing,In Progress,Medium,Low,2026-05-01,2026-11-30,29,275000,92000,High,Green,Global,Application
PRJ-0047,Supplier Sustainability,Procurement,In Progress,Medium,Medium,2026-02-10,2026-10-15,63,240000,151000,High,Amber,EMEA,Compliance
PRJ-0048,AI Legal Research Assistant,Legal,In Progress,High,Medium,2026-04-01,2026-12-20,41,390000,156000,Strategic,Green,Global,Data & AI
PRJ-0049,Workspace Consolidation,Facilities,In Progress,High,High,2026-01-10,2026-08-10,93,680000,710000,Medium,Red,North America,Cost Optimization
PRJ-0050,Omnichannel Support,Customer Service,Not Started,High,Medium,2026-10-01,2027-05-31,0,990000,0,Strategic,Green,Global,Customer Experience
PRJ-0051,Endpoint Management Modernization,IT,Completed,High,Low,2025-09-15,2026-04-15,100,525000,508000,High,Green,Global,Infrastructure
PRJ-0052,Tax Reporting Automation,Finance,In Progress,Critical,Medium,2026-04-01,2026-11-15,45,465000,204000,High,Green,Global,Automation
PRJ-0053,Global Mobility Portal,HR,In Progress,High,Medium,2026-03-15,2026-10-31,56,330000,190000,High,Amber,Global,Application
PRJ-0054,Predictive Maintenance,Operations,In Progress,Critical,High,2026-01-10,2026-10-15,69,1150000,840000,Strategic,Amber,EMEA,Data & AI
PRJ-0055,Sales Coaching Platform,Sales,In Progress,Medium,Low,2026-05-15,2027-01-31,23,285000,68000,High,Green,Global,Application
PRJ-0056,Web Personalization,Marketing,In Progress,High,Medium,2026-04-01,2026-12-01,44,410000,175000,High,Green,Global,Customer Experience
PRJ-0057,Contractor Spend Reduction,Procurement,Completed,High,Low,2025-10-15,2026-06-30,100,180000,168000,High,Green,Global,Cost Optimization
PRJ-0058,Records Retention Program,Legal,In Progress,Critical,High,2026-02-01,2026-09-30,71,530000,452000,Strategic,Amber,Global,Compliance
PRJ-0059,Smart Building Sensors,Facilities,In Progress,Medium,Medium,2026-03-10,2026-11-15,50,440000,222000,High,Green,APAC,Infrastructure
PRJ-0060,Customer Churn Prediction,Customer Service,In Progress,High,Medium,2026-04-01,2026-12-30,40,510000,200000,Strategic,Green,Global,Data & AI
PRJ-0061,Security Operations Automation,IT,In Progress,Critical,Critical,2026-02-01,2026-08-30,89,760000,735000,Strategic,Red,Global,Security
PRJ-0062,Accounts Payable AI,Finance,In Progress,High,Medium,2026-03-01,2026-10-31,60,385000,241000,High,Green,Global,Data & AI
PRJ-0063,HR Service Desk,HR,Completed,Medium,Low,2025-11-01,2026-06-15,100,240000,230000,Medium,Green,Global,Customer Experience
PRJ-0064,Container Tracking Upgrade,Operations,In Progress,High,Medium,2026-05-01,2027-01-31,31,670000,205000,High,Green,Global,Infrastructure
PRJ-0065,Revenue Intelligence,Sales,In Progress,Critical,High,2026-01-15,2026-09-25,79,840000,733000,Strategic,Amber,Global,Data & AI
PRJ-0066,Campaign Automation,Marketing,Completed,Medium,Low,2025-12-01,2026-05-15,100,225000,218000,High,Green,Global,Automation
PRJ-0067,Purchase Order Automation,Procurement,In Progress,High,Medium,2026-03-01,2026-09-30,68,350000,235000,High,Green,Global,Automation
PRJ-0068,Compliance Evidence Portal,Legal,Not Started,Medium,Low,2026-11-01,2027-04-30,0,280000,0,High,Green,Global,Compliance
PRJ-0069,Office Lease Optimization,Facilities,In Progress,High,Medium,2026-02-01,2026-10-30,64,190000,119000,High,Amber,Global,Cost Optimization
PRJ-0070,Customer Feedback Analytics,Customer Service,Completed,High,Low,2025-10-01,2026-05-01,100,315000,301000,High,Green,Global,Data & AI
PRJ-0071,SharePoint Intranet Modernization,IT,In Progress,High,Medium,2026-03-01,2026-11-30,52,480000,246000,High,Green,Global,Transformation
PRJ-0072,Working Capital Optimization,Finance,In Progress,Critical,High,2026-01-05,2026-09-01,83,610000,575000,Strategic,Red,Global,Cost Optimization
PRJ-0073,Talent Marketplace,HR,In Progress,High,Medium,2026-04-01,2026-12-15,43,455000,188000,Strategic,Green,Global,Application
PRJ-0074,Supply Chain Control Tower,Operations,In Progress,Critical,High,2026-01-01,2026-12-31,57,1650000,980000,Strategic,Amber,Global,Transformation
PRJ-0075,Digital Sales Room,Sales,Not Started,Medium,Low,2026-10-15,2027-04-15,0,340000,0,High,Green,Global,Customer Experience
PRJ-0076,Marketing Attribution,Marketing,In Progress,High,Medium,2026-03-01,2026-10-15,61,430000,268000,High,Green,Global,Data & AI
PRJ-0077,Supplier Onboarding Automation,Procurement,In Progress,Medium,Low,2026-04-15,2026-12-31,38,270000,101000,High,Green,Global,Automation
PRJ-0078,Legal Intake Portal,Legal,Completed,Medium,Low,2025-11-15,2026-05-31,100,185000,179000,Medium,Green,Global,Application
PRJ-0079,Visitor Management Upgrade,Facilities,In Progress,Medium,Medium,2026-05-01,2026-12-20,32,240000,77000,Medium,Green,Global,Security
PRJ-0080,Agent Assisted Support,Customer Service,In Progress,Critical,High,2026-02-15,2026-09-30,72,690000,529000,Strategic,Amber,Global,Data & AI
PRJ-0081,Data Platform Modernization,IT,In Progress,Critical,High,2026-01-01,2027-03-31,39,2200000,880000,Strategic,Amber,Global,Data & AI
PRJ-0082,FP&A Transformation,Finance,In Progress,High,Medium,2026-02-01,2026-12-31,49,720000,353000,Strategic,Green,Global,Transformation
PRJ-0083,Recruitment Automation,HR,In Progress,Medium,Low,2026-06-01,2027-01-31,18,310000,54000,High,Green,Global,Automation
PRJ-0084,Last Mile Optimization,Operations,In Progress,High,Medium,2026-04-01,2026-12-15,45,610000,282000,High,Green,APAC,Cost Optimization
PRJ-0085,Account Planning Platform,Sales,Completed,Medium,Low,2025-09-01,2026-04-01,100,390000,381000,High,Green,Global,Application
PRJ-0086,Content Supply Chain,Marketing,In Progress,High,High,2026-02-01,2026-09-10,82,570000,536000,High,Red,Global,Transformation
PRJ-0087,Vendor Master Cleanup,Procurement,Completed,Medium,Low,2025-10-01,2026-03-30,100,160000,154000,Medium,Green,Global,Business Improvement
PRJ-0088,Policy Management Platform,Legal,In Progress,High,Medium,2026-04-01,2026-11-30,46,350000,166000,High,Green,Global,Compliance
PRJ-0089,Office Energy Reduction,Facilities,In Progress,High,Low,2026-01-15,2026-12-31,54,310000,144000,High,Green,EMEA,Cost Optimization
PRJ-0090,Customer Journey Analytics,Customer Service,In Progress,High,Medium,2026-03-01,2026-11-30,50,525000,253000,Strategic,Green,Global,Data & AI
PRJ-0091,Network Modernization,IT,On Hold,Critical,High,2026-01-15,2026-10-01,48,1350000,720000,Strategic,Red,Global,Infrastructure
PRJ-0092,Collections Optimization,Finance,In Progress,High,Medium,2026-04-01,2026-12-10,42,390000,170000,High,Green,Global,Data & AI
PRJ-0093,Learning Analytics,HR,In Progress,Medium,Low,2026-05-01,2026-12-31,28,245000,69000,Medium,Green,Global,Data & AI
PRJ-0094,Warehouse Robotics Pilot,Operations,In Progress,Critical,High,2026-03-01,2026-09-30,71,890000,685000,Strategic,Amber,APAC,Automation
PRJ-0095,Quote Automation,Sales,In Progress,High,Medium,2026-04-01,2026-11-15,41,460000,186000,High,Green,Global,Automation
PRJ-0096,Digital Asset Management,Marketing,Completed,Medium,Low,2025-11-01,2026-06-30,100,370000,355000,High,Green,Global,Application
PRJ-0097,Procurement Copilot,Procurement,In Progress,High,Medium,2026-05-01,2027-01-31,25,415000,93000,Strategic,Green,Global,Data & AI
PRJ-0098,eDiscovery Modernization,Legal,In Progress,Critical,High,2026-02-01,2026-08-01,95,620000,645000,Strategic,Red,Global,Compliance
PRJ-0099,Facilities Service App,Facilities,In Progress,Medium,Low,2026-06-01,2027-02-28,15,280000,42000,Medium,Green,Global,Application
PRJ-0100,Support Knowledge Copilot,Customer Service,In Progress,High,Medium,2026-04-01,2026-12-31,38,430000,171000,Strategic,Green,Global,Data & AI
PRJ-0101,Application Rationalization,IT,In Progress,High,Medium,2026-03-01,2027-01-31,34,750000,263000,High,Green,Global,Cost Optimization
PRJ-0102,Financial Data Lake,Finance,In Progress,Critical,High,2026-01-15,2027-02-28,36,1350000,480000,Strategic,Amber,Global,Data & AI
PRJ-0103,HR Policy Copilot,HR,Not Started,Medium,Low,2026-11-01,2027-03-31,0,220000,0,High,Green,Global,Data & AI
PRJ-0104,Port Capacity Planning,Operations,In Progress,High,Medium,2026-03-01,2026-12-31,48,640000,310000,High,Green,EMEA,Data & AI
PRJ-0105,Customer 360,Sales,In Progress,Critical,High,2026-02-01,2027-01-31,43,1450000,590000,Strategic,Amber,Global,Data & AI
PRJ-0106,Marketing Copilot,Marketing,In Progress,High,Medium,2026-04-01,2026-12-20,39,360000,137000,Strategic,Green,Global,Data & AI
PRJ-0107,Supplier Negotiation Analytics,Procurement,In Progress,High,Low,2026-05-01,2026-12-31,29,325000,88000,High,Green,Global,Data & AI
PRJ-0108,Legal Knowledge Copilot,Legal,In Progress,High,Medium,2026-03-01,2026-11-15,52,410000,221000,Strategic,Green,Global,Data & AI
PRJ-0109,Smart Workspace Analytics,Facilities,In Progress,Medium,Low,2026-05-01,2027-01-31,27,290000,76000,High,Green,Global,Data & AI
PRJ-0110,Customer Sentiment AI,Customer Service,In Progress,High,Medium,2026-03-15,2026-11-30,47,385000,172000,High,Green,Global,Data & AI
PRJ-0111,AI Developer Platform,IT,Not Started,Critical,Medium,2026-10-01,2027-09-30,0,1750000,0,Strategic,Green,Global,Data & AI
PRJ-0112,Finance Copilot Adoption,Finance,In Progress,Medium,Low,2026-06-01,2026-12-15,21,180000,37000,High,Green,Global,Business Improvement
PRJ-0113,Workforce Planning AI,HR,In Progress,High,Medium,2026-04-15,2026-12-31,37,450000,169000,Strategic,Green,Global,Data & AI
PRJ-0114,Operations Digital Twin,Operations,Not Started,Critical,High,2026-11-01,2028-03-31,0,2800000,0,Strategic,Amber,Global,Transformation
PRJ-0115,Pipeline Intelligence,Sales,In Progress,High,Medium,2026-05-01,2027-01-15,26,580000,143000,Strategic,Green,Global,Data & AI
PRJ-0116,Personalized Campaign AI,Marketing,In Progress,High,Medium,2026-06-01,2027-02-28,20,495000,91000,Strategic,Green,Global,Data & AI
PRJ-0117,Procurement Data Platform,Procurement,In Progress,Critical,High,2026-02-01,2026-10-01,81,730000,681000,Strategic,Red,Global,Data & AI
PRJ-0118,Contract Risk AI,Legal,In Progress,High,Medium,2026-04-01,2026-12-31,40,465000,181000,Strategic,Green,Global,Data & AI
PRJ-0119,Building Maintenance AI,Facilities,In Progress,High,Medium,2026-03-15,2026-12-20,46,420000,194000,High,Green,APAC,Data & AI
PRJ-0120,Customer Service Transformation,Customer Service,Not Started,Critical,Medium,2026-10-01,2027-09-30,0,1850000,0,Strategic,Green,Global,Transformation
For the Project Manager and Sponsor Person columns, assign actual users from your Microsoft 365 tenant after importing the data.
Step 4: Validate the List Before Using Copilot
Before creating the dashboard, verify the list.
Check that:
- Currency columns contain numbers.
- Completion values are between 0 and 100.
- Dates are valid.
- Department values are standardized.
- Status values use the defined choices.
- Risk values are standardized.
- Health values contain only Green, Amber or Red.
- Every project has a unique Project ID.
This is important because the quality of any AI-generated dashboard depends heavily on the quality of the source data.
Step 5: Start with a Simple Copilot Prompt
Open the Enterprise Project Portfolio list and start Copilot.
Do not start with a highly complicated prompt.
First verify that Copilot understands the dataset.
Use:
Analyze this Project Portfolio list.

Tell me:
- total number of projects
- projects by status
- projects by department
- total approved budget
- total actual spend
- projects with High or Critical risk
- projects with Red health
Review the answer.
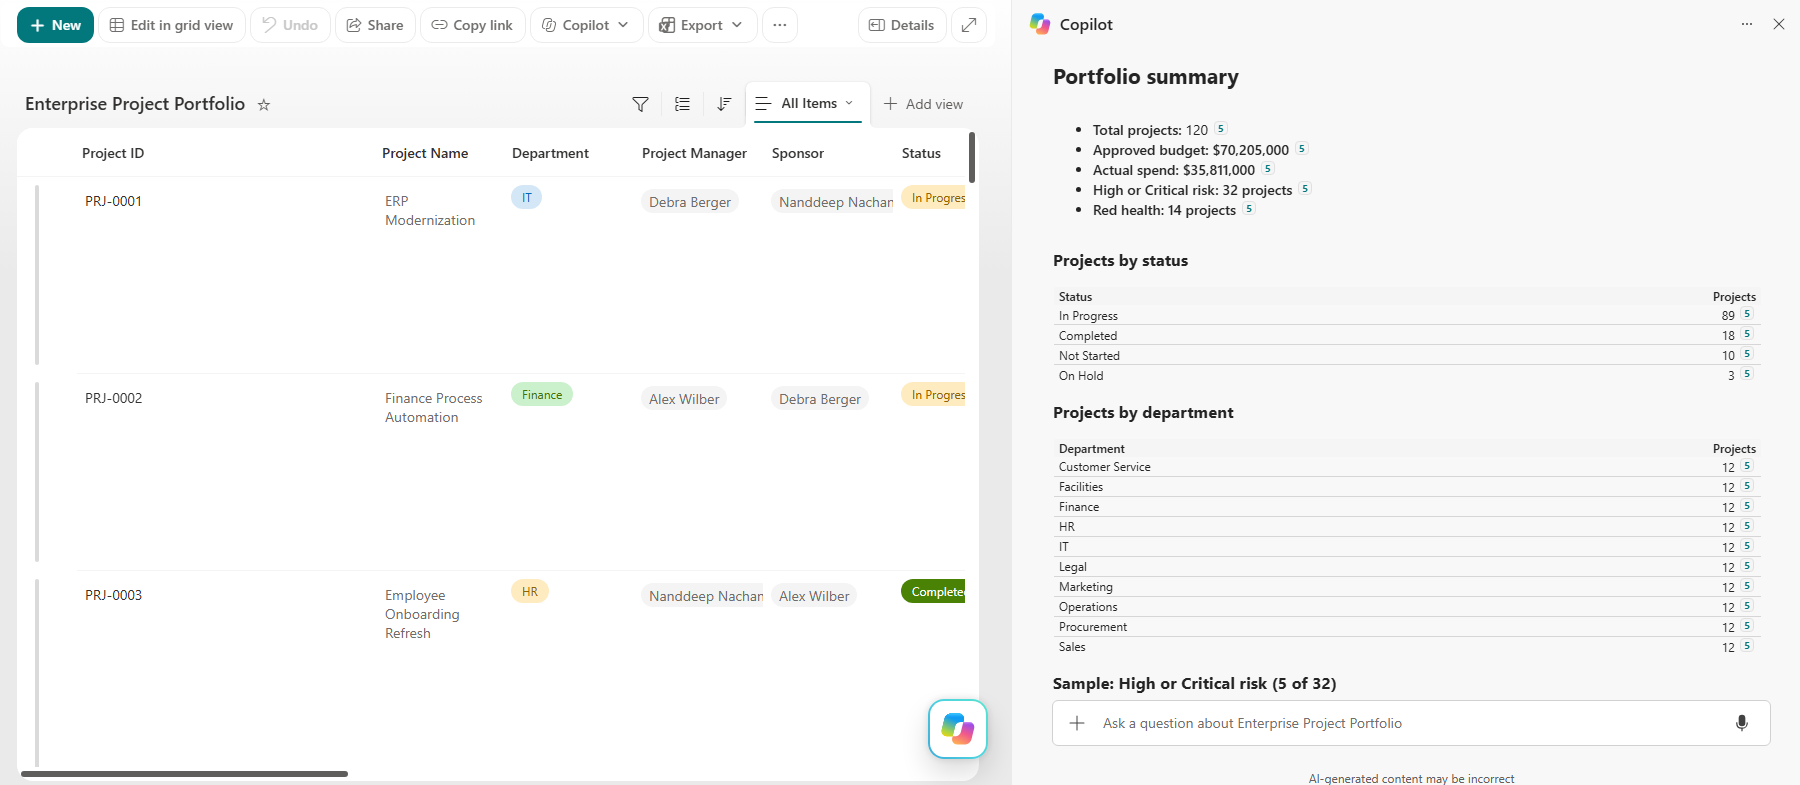
This validates that Copilot understands the important fields before asking it to build a dashboard.
Step 6: Generate the First Dashboard
Now provide a dashboard-generation prompt.
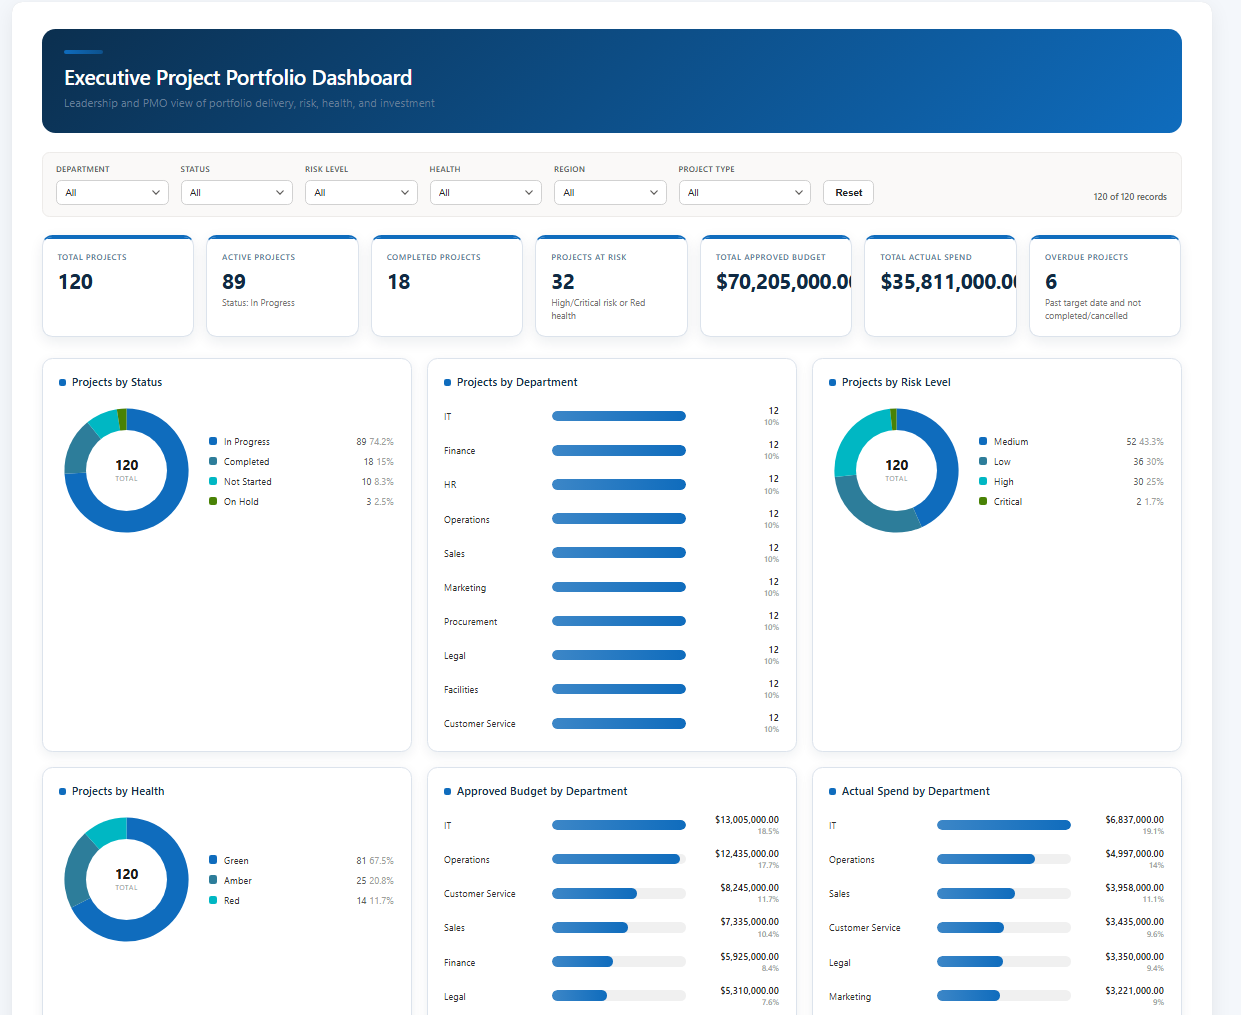
Create an interactive executive Project Portfolio dashboard from this SharePoint list.

The dashboard is for senior leadership and the PMO.

At the top, create KPI cards for:

1. Total Projects
2. Active Projects
3. Completed Projects
4. Projects At Risk
5. Total Approved Budget
6. Total Actual Spend
7. Overdue Projects

Treat "In Progress" projects as Active Projects.

Treat a project as At Risk when:
- Risk Level is High or Critical
OR
- Health is Red.

Treat a project as overdue when:
- Target Date is earlier than today
AND
- Status is not Completed
AND
- Status is not Cancelled.

Format budget amounts as currency.

Below the KPI cards, add interactive charts for:
- Projects by Status
- Projects by Department
- Projects by Risk Level
- Projects by Health
- Approved Budget by Department
- Actual Spend by Department
- Project Type distribution
- Projects by Region

Add filters for:
- Department
- Status
- Risk Level
- Health
- Region
- Project Type

All charts and KPI cards should respond to the selected filters.

Use a clean modern executive dashboard design.
This should form the basic dashboard.
Step 7: Add a Portfolio Health Section
After the dashboard is generated, refine it.
Prompt Copilot:
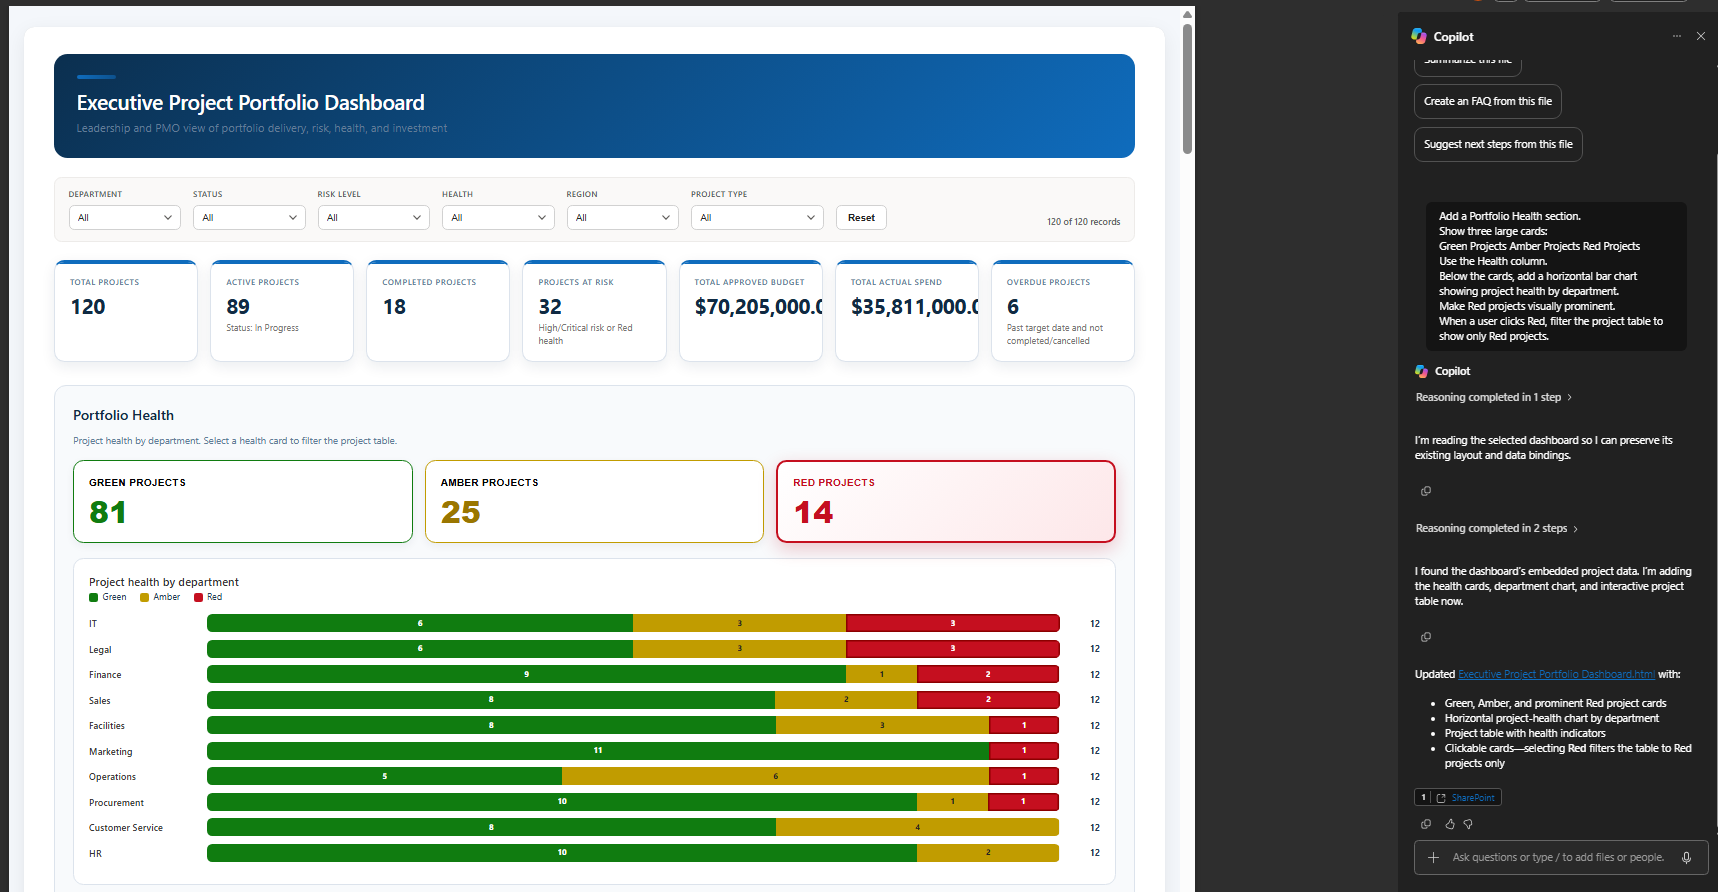
Add a Portfolio Health section.

Show three large cards:

Green Projects
Amber Projects
Red Projects

Use the Health column.

Below the cards, add a horizontal bar chart showing project health by department.

Make Red projects visually prominent.

When a user clicks Red, filter the project table to show only Red projects.
This helps senior managers quickly identify troubled projects.
Step 8: Add Financial Analysis
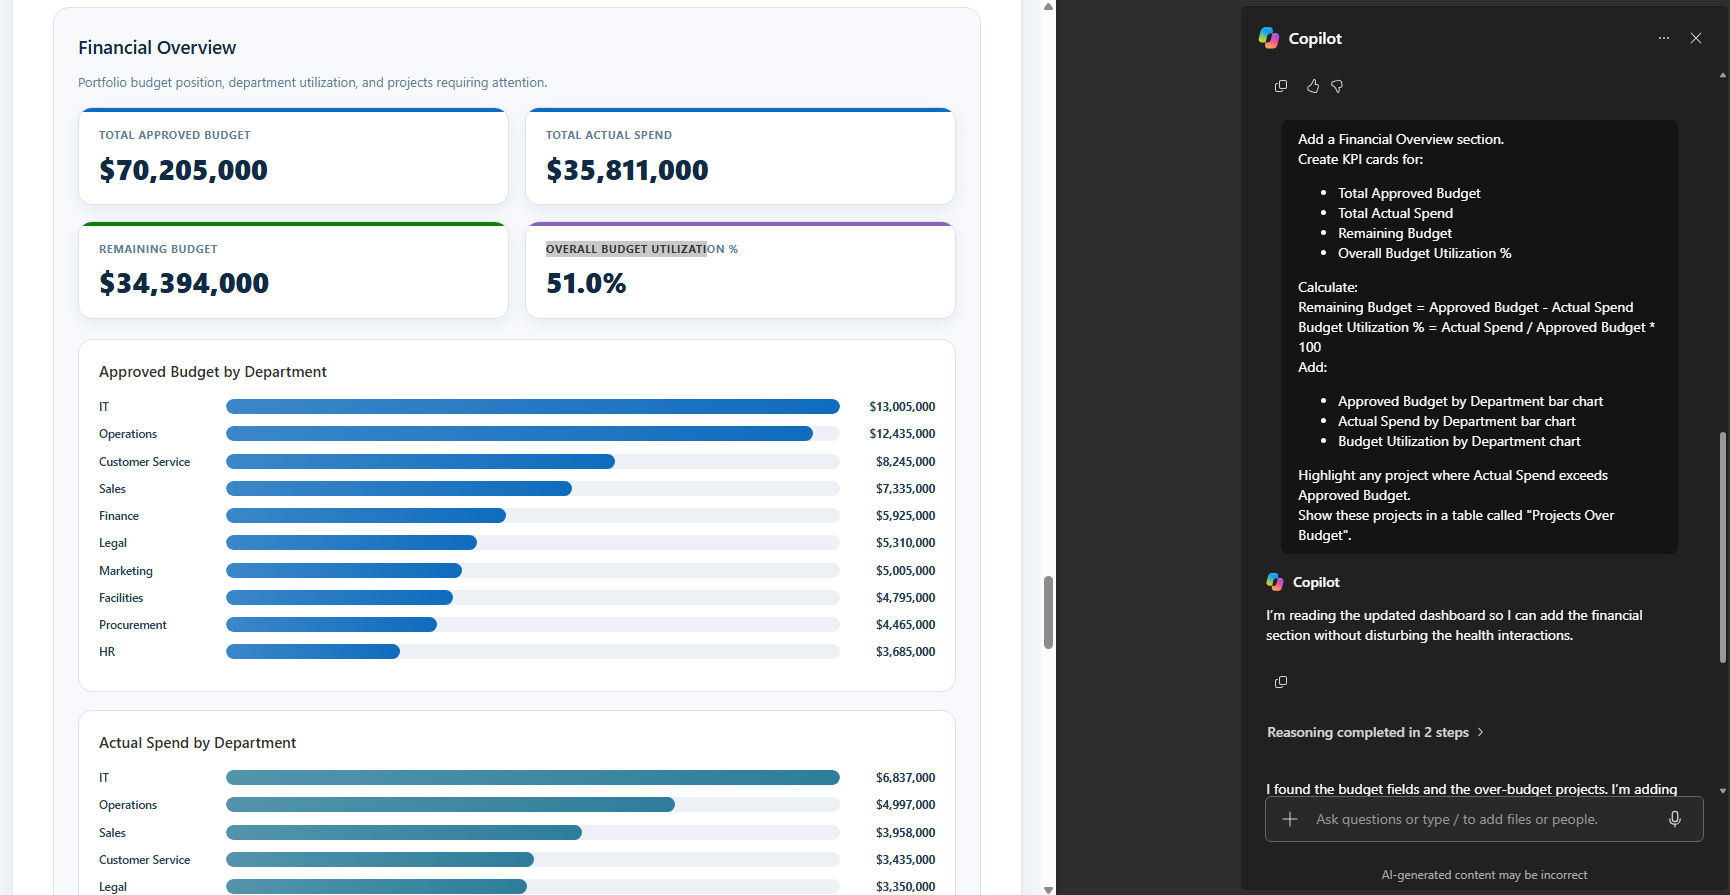
Use another prompt:
Add a Financial Overview section.

Create KPI cards for:

- Total Approved Budget
- Total Actual Spend
- Remaining Budget
- Overall Budget Utilization %

Calculate:

Remaining Budget =
Approved Budget - Actual Spend

Budget Utilization % =
Actual Spend / Approved Budget * 100

Add:

- Approved Budget by Department bar chart
- Actual Spend by Department bar chart
- Budget Utilization by Department chart

Highlight any project where Actual Spend exceeds Approved Budget.

Show these projects in a table called "Projects Over Budget".
This turns the dashboard into both a portfolio-health and financial-management tool.
Step 9: Add Project Progress Analysis
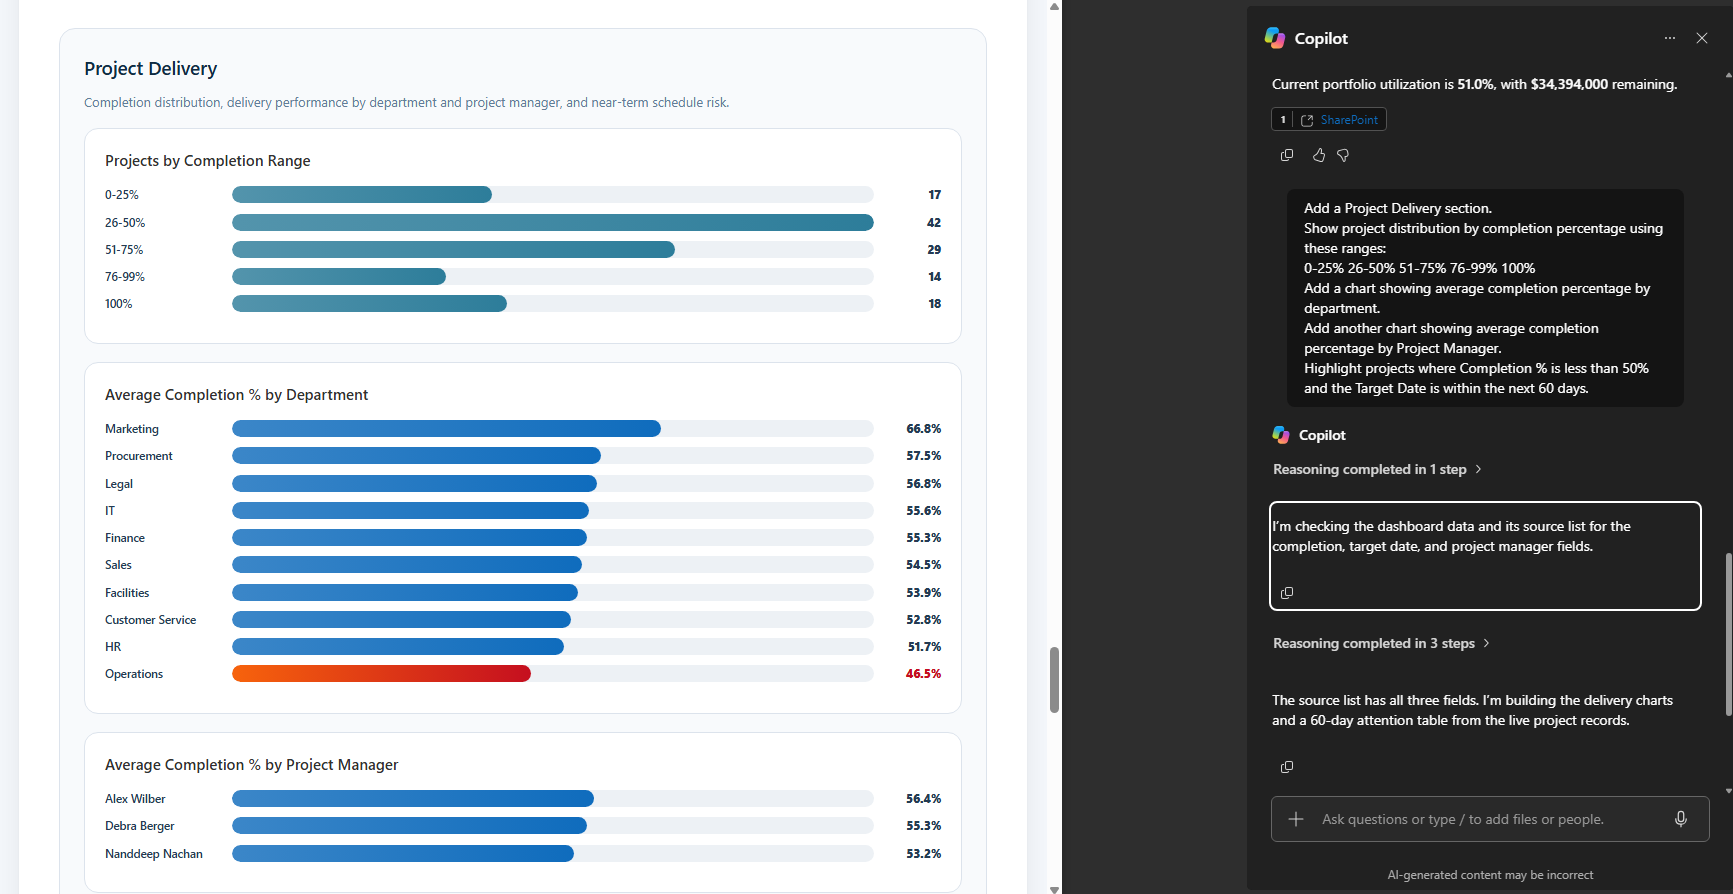
Prompt:
Add a Project Delivery section.

Show project distribution by completion percentage using these ranges:

0-25%
26-50%
51-75%
76-99%
100%

Add a chart showing average completion percentage by department.

Add another chart showing average completion percentage by Project Manager.

Highlight projects where Completion % is less than 50% and the Target Date is within the next 60 days.
This helps identify projects that may be heading toward delivery problems.
Step 10: Add a Management Attention Section
One of the most useful additions is an exception-focused section.
Prompt:
Create a section called "Management Attention Required".

Include projects where any of these conditions are true:

- Health = Red
- Risk Level = Critical
- Actual Spend > Approved Budget
- Target Date has passed and project is not Completed
- Completion % is below 50 and Target Date is within 60 days

Display these projects in a table.

Columns should include:

Project ID
Project Name
Department
Project Manager
Status
Health
Risk Level
Completion %
Target Date
Approved Budget
Actual Spend

Sort the table so the most critical projects appear first.
The important idea is that executives should not have to inspect every project.
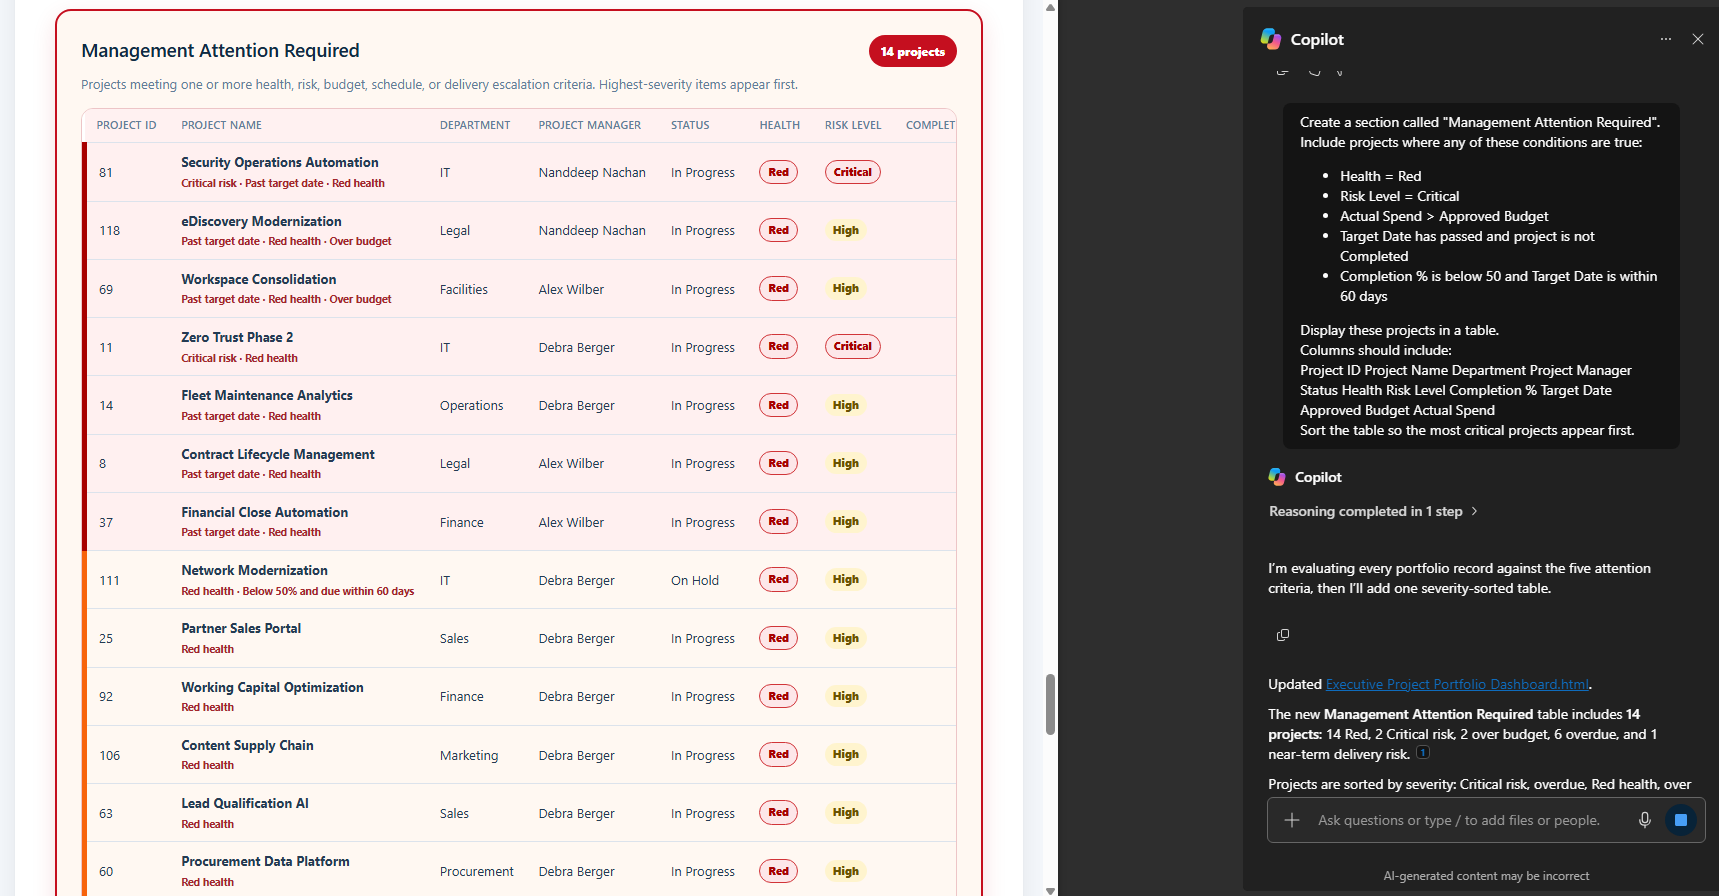
The dashboard should surface exceptions automatically.
Step 11: Add Search
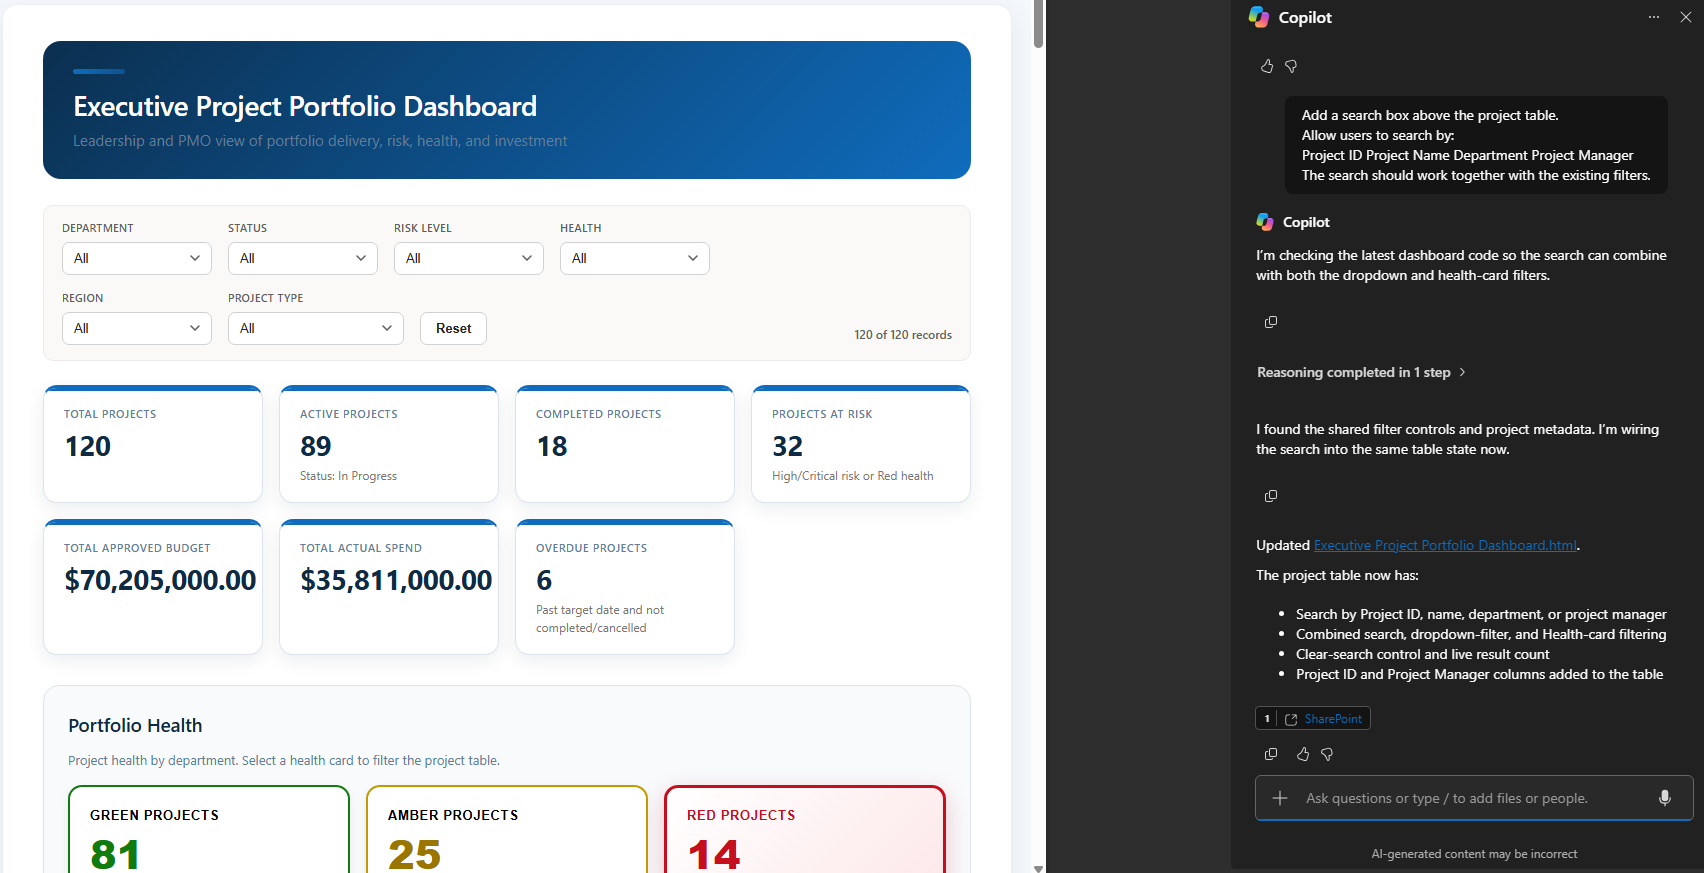
Prompt Copilot:
Add a search box above the project table.

Allow users to search by:

Project ID
Project Name
Department
Project Manager

The search should work together with the existing filters.
Step 12: Add a Detailed Project Table
Prompt:
At the bottom of the dashboard, create a detailed interactive table.

Include:

Project ID
Project Name
Department
Project Manager
Status
Priority
Risk Level
Health
Completion %
Target Date
Approved Budget
Actual Spend
Region
Project Type

Allow sorting by every column.

Add pagination if necessary.

Allow the user to filter the table using the dashboard filters.
Step 13: Make the Project Name Clickable
Now connect dashboard insights back to SharePoint.
Prompt:
Make each Project Name in the project table clickable.

When the Project Name is clicked, open the corresponding SharePoint list item.

Use the SharePoint list item ID to create the link to the item's display form.

Open the SharePoint item in a new browser tab.
This creates an experience such as:
Dashboard
    ↓
Critical Projects
    ↓
ERP Modernization
    ↓
Click project
    ↓
SharePoint Project Item
This is particularly useful because SharePoint remains the location where the actual business record is maintained.
Step 14: Add Reset Filters
Prompt:
Add a prominent "Reset Filters" button.

When clicked:

- clear Department
- clear Status
- clear Risk Level
- clear Health
- clear Region
- clear Project Type
- clear search text

Return the dashboard to the complete portfolio view.
Step 15: Add an Executive Summary
The dashboard can also contain a text summary.
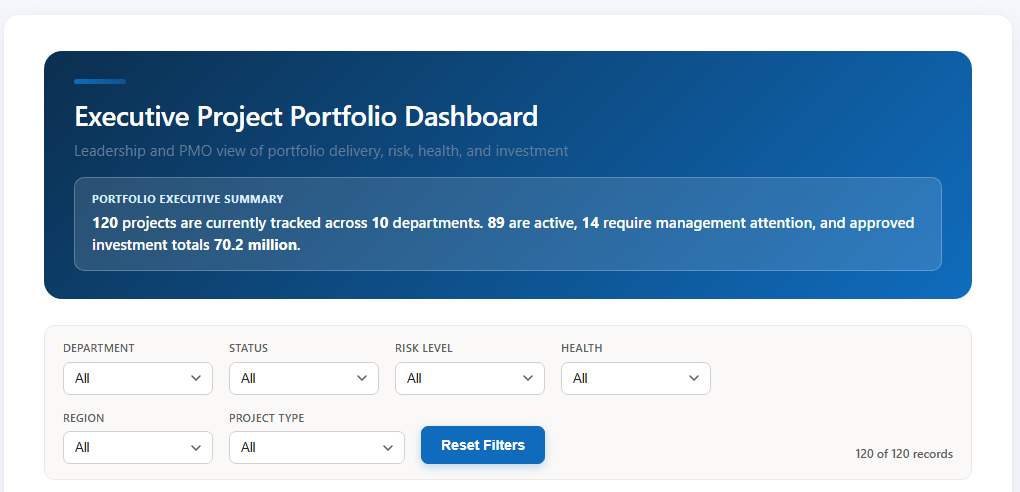
Prompt:
At the top of the dashboard, below the title, add a short Portfolio Executive Summary.

The summary should dynamically describe the current filtered data.

For example:

"120 projects are currently tracked across 10 departments. 73 projects are active, 14 require management attention and total approved investment is $XX million."

Keep the summary short and executive friendly.
Be particularly careful with dynamically generated narrative text.
Validate that the underlying calculations accurately represent the filtered data.
Step 16: Refine the Visual Design
Once the functionality is correct, improve the visual layout.
Use:
Improve the dashboard design.

Use a clean Microsoft 365-style business interface.

Use:

- clear dashboard title
- white background
- subtle card borders
- rounded KPI cards
- consistent spacing
- responsive layout
- accessible typography
- compact filter bar
- clear chart titles

Use Green, Amber and Red only when representing project health.

Keep the overall design professional and suitable for an executive SharePoint portal.

Do not make the dashboard visually crowded.
Step 17: Final Dashboard Layout
The final dashboard could look conceptually like this:
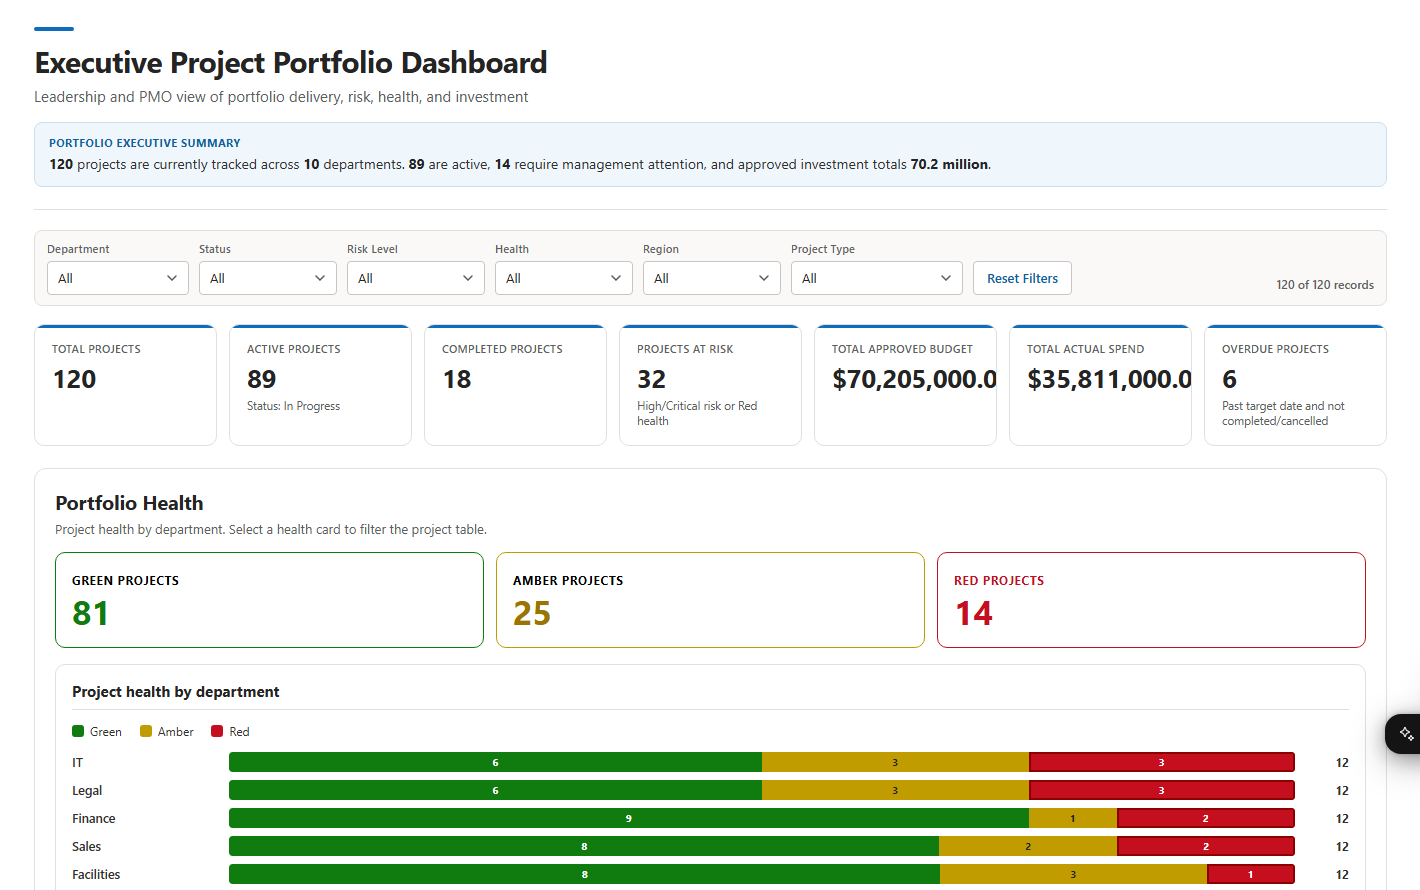
The numbers shown here are illustrative. The dashboard itself should calculate the exact values from the SharePoint List.
Step 18: Add an “Add Project” Button
The dashboard can also provide an easy path to create new records.
Prompt:
Add a button labeled "+ Add Project" in the top-right corner of the dashboard.

When clicked, open the New Item form of the Enterprise Project Portfolio SharePoint list in a new tab.

Do not create a custom data entry form inside the dashboard.

Continue using the SharePoint list as the system of record.
This results in:
                         [+ Add Project]

Dashboard
    ↓
Add Project
    ↓
SharePoint New Item Form
    ↓
Save
    ↓
SharePoint List
    ↓
Refresh Dashboard
    ↓
New Project Appears
That is an excellent demonstration of why the experience can be considered live rather than simply an AI-generated static report.
Step 19: Test the Live Behavior
After creating the dashboard, perform a simple test.
Choose a project such as:
PRJ-0001
ERP Modernization
Health = Amber
Risk = High
Change:
Health = Red
Save the SharePoint item.
Refresh the dashboard.
Verify that:
- Red project count increases.
- Amber project count decreases.
- The project appears in Management Attention Required.
- The health chart updates.
- The department health chart updates.
Then add a completely new SharePoint item.
For example:
PRJ-0121
AI Governance Platform
IT
In Progress
Critical
High
Strategic
Red
Refresh the dashboard again.
The new record should become part of the visualization if the dashboard is correctly retrieving current SharePoint List data.
This is the critical demo moment.
You are demonstrating:
Change SharePoint data
       ↓
Refresh dashboard
       ↓
Dashboard changes
rather than:
Change SharePoint data
       ↓
Ask Copilot again
       ↓
Generate new report
Step 20: Publish the Dashboard
Once the dashboard has been reviewed and validated, publish it within the project management portal.
A SharePoint PMO home page might contain:
Project Management Office

----------------------------------------------------

Enterprise Project Portfolio

[ Live Portfolio Dashboard ]

----------------------------------------------------

Quick Actions

[ Submit Project ]
[ Project Governance ]
[ Project Templates ]
[ PMO Policies ]
[ Steering Committee ]

----------------------------------------------------

Upcoming Reviews

Portfolio Review
Architecture Review
Investment Review
Risk Committee

----------------------------------------------------
The generated dashboard becomes part of the larger SharePoint business experience rather than simply remaining an isolated HTML artifact.
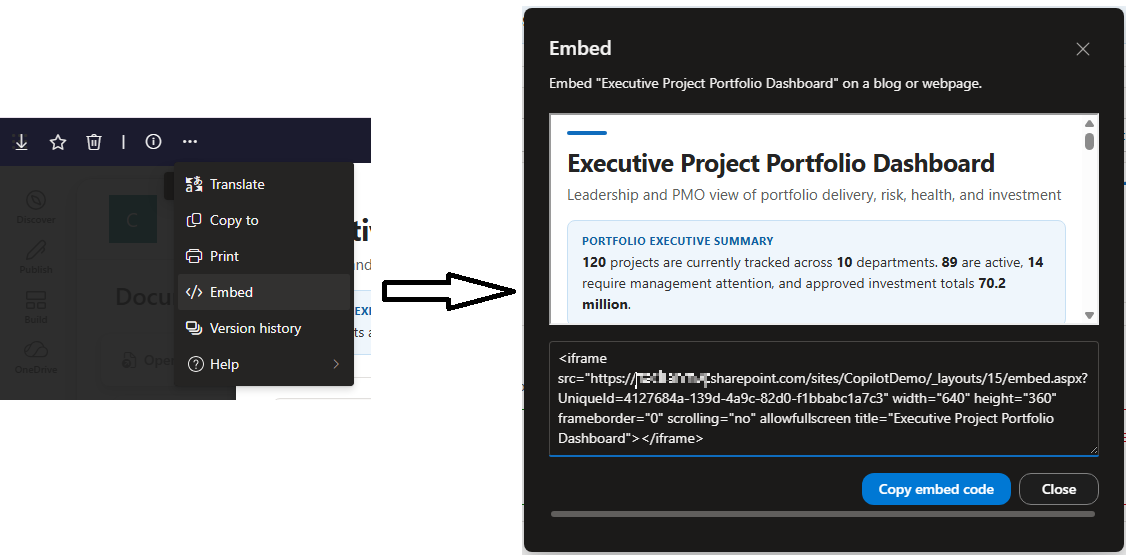
Embed Report in SharePoint
Follow the steps below to embed this report in SharePoint.
- From options, select Embed.
-
Click Copy embed code.
-
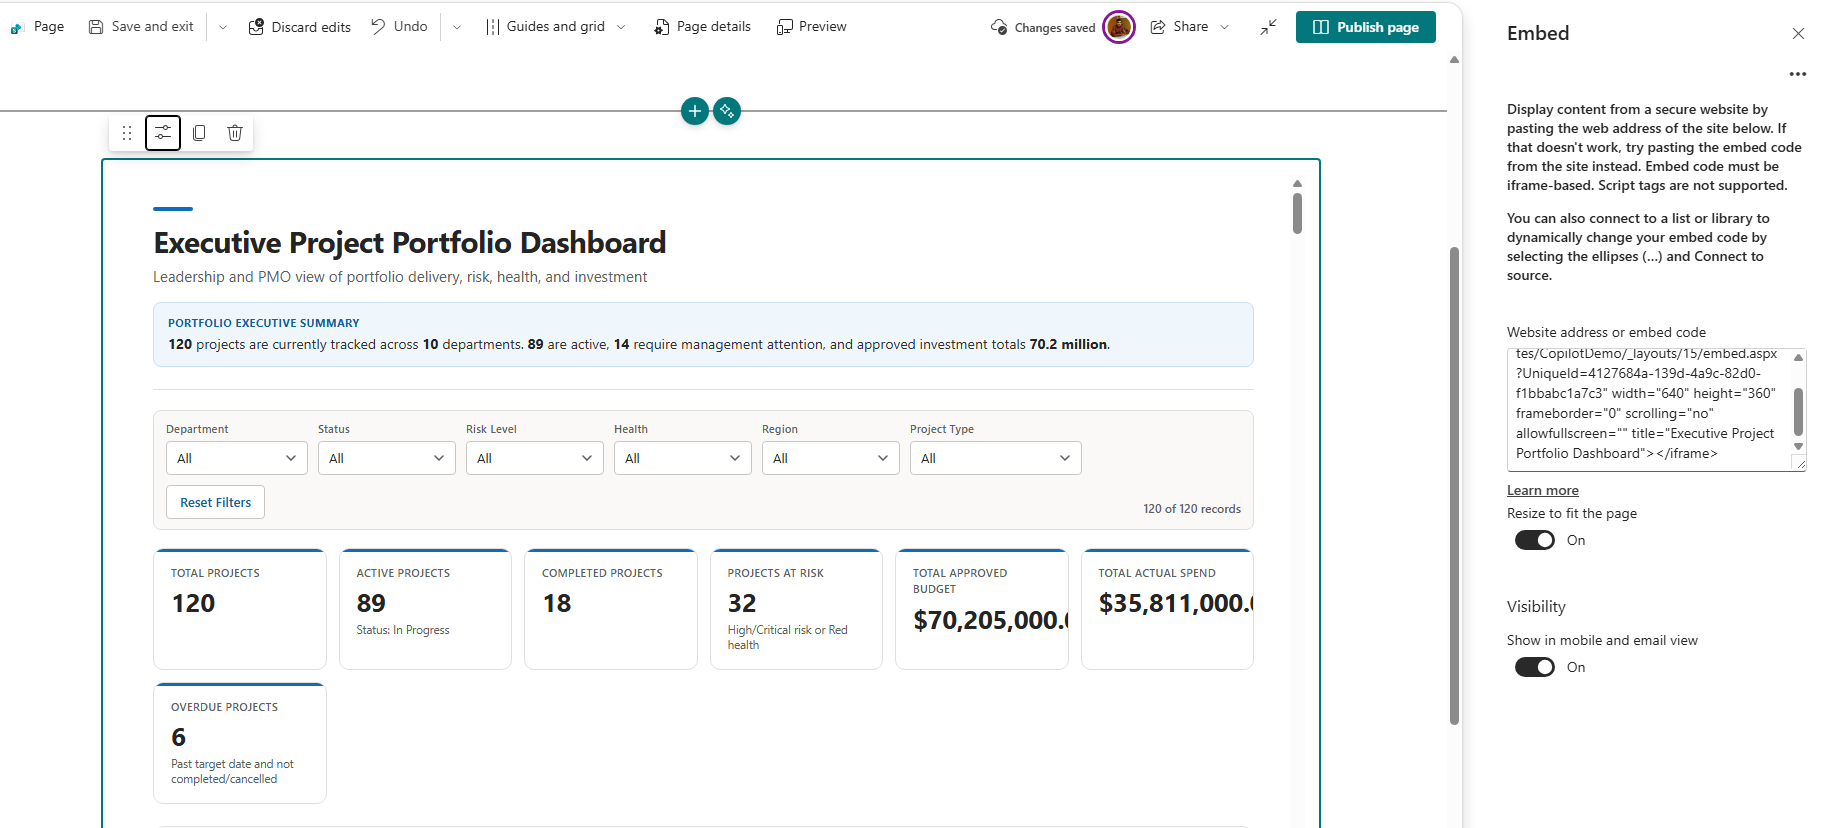
Add Embed web part on SharePoint page.
Advanced Prompt: Create Everything in One Request
After becoming comfortable with the capability, you could try a much more detailed single prompt.
Create a complete interactive executive Project Portfolio dashboard using the current Enterprise Project Portfolio SharePoint list.

Audience:
Senior leadership and the Project Management Office.

Create a professional responsive dashboard.

FILTERS

Add filters for:

- Department
- Status
- Risk Level
- Health
- Region
- Project Type

Also add:

- Project search box
- Reset Filters button

All KPIs, charts and tables must respond to these filters.

EXECUTIVE KPIs

Create KPI cards for:

- Total Projects
- Active Projects
- Completed Projects
- Projects At Risk
- Overdue Projects
- Total Approved Budget
- Total Actual Spend
- Remaining Budget
- Budget Utilization %

Definitions:

Active Project =
Status is In Progress.

At Risk =
Risk Level is High or Critical
OR
Health is Red.

Overdue =
Target Date is before today
AND
Status is not Completed
AND
Status is not Cancelled.

Remaining Budget =
Approved Budget - Actual Spend.

Budget Utilization =
Actual Spend / Approved Budget × 100.

PORTFOLIO HEALTH

Show:

- Green project count
- Amber project count
- Red project count

Add charts:

- Projects by Health
- Health by Department

PORTFOLIO ANALYSIS

Add charts:

- Projects by Status
- Projects by Department
- Projects by Risk Level
- Projects by Priority
- Projects by Region
- Projects by Project Type

FINANCIAL ANALYSIS

Add:

- Approved Budget by Department
- Actual Spend by Department
- Budget Utilization by Department

Highlight projects where Actual Spend exceeds Approved Budget.

DELIVERY ANALYSIS

Group projects into:

- 0-25%
- 26-50%
- 51-75%
- 76-99%
- 100%

Show:

- completion distribution
- average completion by department

MANAGEMENT ATTENTION

Create a table showing projects meeting any of these conditions:

- Health = Red
- Risk Level = Critical
- Actual Spend > Approved Budget
- project is overdue
- Completion % < 50 and Target Date is within 60 days

Include:

Project ID
Project Name
Department
Project Manager
Status
Risk Level
Health
Completion %
Target Date
Approved Budget
Actual Spend

PROJECT DETAILS

Create a searchable sortable project table containing all projects.

Make Project Name clickable and open the corresponding SharePoint list item using its item ID.

Add an "+ Add Project" button that opens the SharePoint New Item form.

DESIGN

Use a modern Microsoft 365-style design suitable for executives.

Use Green, Amber and Red primarily for project health indicators.

Keep the interface clean, accessible and responsive.

Do not overcrowd the screen.

The dashboard must use the SharePoint list as its data source rather than embedding a static copy of the list values.
This prompt is particularly useful as a demo because it shows how far we have moved from:
writing code
to
describing intent.
Use Cases Based on the Same Pattern
Once this example is working, you can replace the Project Portfolio list with almost any structured business dataset.
| List | Possible Dashboard |
|---|---|
| IT Service Requests | Support Operations Dashboard |
| Risk Register | Enterprise Risk Dashboard |
| Training Registrations | Learning Analytics Dashboard |
| Procurement Requests | Procurement Spend Dashboard |
| Vendor Register | Supplier Performance Dashboard |
| Facilities Requests | Facilities Operations Dashboard |
| Security Incidents | Cybersecurity Dashboard |
| Employee Ideas | Innovation Dashboard |
| Change Requests | Change Management Dashboard |
| Sales Opportunities | Sales Pipeline Dashboard |
| Audit Findings | Compliance Dashboard |
| Asset Register | Asset Lifecycle Dashboard |
The underlying pattern remains the same:
Structured SharePoint data
            ↓
Natural-language requirement
            ↓
Copilot
            ↓
Interactive dashboard
            ↓
Business decision
            ↓
Open underlying SharePoint record
            ↓
Take action
Security and Permissions
AI-generated dashboards should not become a mechanism for bypassing SharePoint security.
The underlying data permissions remain important.
In community testing, a user with permission to the underlying list could view the dashboard data. When the user’s access to the source list was removed, the dashboard could no longer load that data.
Conceptually:
User
 |
 |---- Can access dashboard HTML
 |
 |---- Can access SharePoint List?
             |
          YES ---> Data loads
             |
          NO ----> Data unavailable
This is an important architectural property.
It means the dashboard should be treated as another presentation experience over SharePoint rather than a copied dataset intentionally exposed independently of SharePoint security.
Organizations should still validate the behavior for their specific implementation before publishing dashboards containing sensitive information.
Licensing and Preview Considerations
As of August 2026, this functionality needs to be viewed in the context of the Copilot in SharePoint preview.
Microsoft states that the preview began rolling out from mid-June 2026 as an opt-out preview for users with a Microsoft Copilot license. Microsoft also applies per-user daily and weekly usage limits during the preview, and those limits may change as the service evolves.
Community testing further indicates that a Microsoft 365 Copilot license is required for the person creating the dashboard, while people simply viewing an already-created dashboard do not necessarily require Copilot solely for viewing it.
Because the capability is still preview, organizations should verify current Microsoft documentation before making licensing, governance or production architecture decisions.
This Is Not a Replacement for Power BI
Seeing an attractive dashboard generated in minutes naturally raises the question:
Do we still need Power BI?
Absolutely.
These capabilities solve different levels of reporting requirements.
| Requirement | Copilot + SharePoint Dashboard | Power BI |
|---|---|---|
| Quick dashboard | Excellent | Good |
| SharePoint List reporting | Excellent | Excellent |
| No-code prototyping | Excellent | Good |
| Interactive filtering | Yes | Yes |
| Enterprise semantic model | Limited | Excellent |
| Complex DAX | No | Yes |
| Advanced data modelling | Limited | Excellent |
| Multiple enterprise systems | Limited | Excellent |
| Large analytical datasets | Not primary use | Excellent |
| Formal BI governance | Limited | Excellent |
| Department dashboard | Excellent | Excellent |
| Rapid experimentation | Excellent | Good |
The decision should not be:
Copilot or Power BI?
Instead, think of a reporting spectrum:
Simple
  |
  | SharePoint Views
  |
  | Copilot-generated Dashboard
  |
  | Power Apps / Custom Solutions
  |
  | Power BI
  |
Complex
Copilot potentially fills an important gap between a standard SharePoint view and a formally engineered BI solution.
Governance Becomes More Important
If users can generate applications and dashboards through prompts, organizations should think carefully about governance.
Consider questions such as:
Where are generated HTML files stored?
Establish appropriate libraries or locations for business dashboards.
Who owns the dashboard?
A generated dashboard supporting an important business process should have an identified owner.
Who owns the underlying data?
Dashboard quality is ultimately dependent on source-data quality.
How are dashboards reviewed?
Users should validate calculations, filters and aggregations before treating an AI-generated dashboard as authoritative.
How are changes managed?
Before making significant modifications, keeping a previous copy of the HTML can be useful. This is also recommended in community walkthroughs of the capability.
What data is appropriate?
Sensitive business information should follow existing SharePoint information architecture, permission and compliance policies.
AI makes creation faster.
It does not remove the need for governance.
Summary
Copilot in SharePoint is moving beyond simply answering questions about documents.
Microsoft now positions it as an experience capable of creating sites, pages, lists, libraries, Office files and interactive reports using natural language, and the August 2026 SharePoint update specifically highlights live dashboards connected to lists and files.
That enables an interesting new pattern:
SharePoint List → Natural-language prompt → Interactive HTML dashboard → SharePoint page
Unlike a static AI-generated report, a dashboard connected to a SharePoint List can retrieve current data when opened or refreshed. Community demonstrations show dashboards responding to changes in the underlying lists without requiring the HTML file to be regenerated.
For lightweight departmental reporting, project dashboards, risk registers, service management, training analytics, procurement, finance and similar scenarios, this could dramatically shorten the path from structured data to a usable interactive experience.
It does not eliminate Power BI, Power Apps, SPFx or traditional development.
Instead, it introduces another layer:
prompt-driven business experience development.
And perhaps the bigger story is not that Copilot can create a chart.
It is that an employee can increasingly describe the business experience they need, and Copilot can build that experience directly around the organization’s existing Microsoft 365 data.
That turns SharePoint from simply a place where business data lives into a platform where AI can help turn that data into live, interactive applications and dashboards.

Leave a comment