
Debugging SPFx Solutions
Overview
In the developer’s life - a code working on one environment might not work on other environment. Every user and environment is unique, so this can be caused by anything. The best possible approach to tackle these issues is by debugging the situation and find the root cause of the issue.
In this article, we will explore the options to debug the SharePoint framework solutions in order to find out the specific issue.
Develop SharePoint Framework Web Part
-
Open command prompt. Create a directory for SPFx solution.
md debug-spfx-solution -
Navigate to above created directory.
cd debug-spfx-solution -
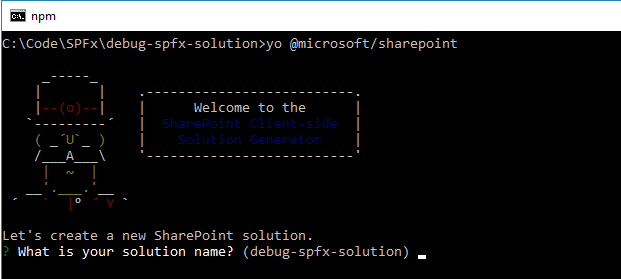
Run Yeoman SharePoint Generator to create the solution.
yo @microsoft/sharepoint -
Yeoman generator will present you with the wizard by asking questions about the solution to be created.
- Solution Name: Hit enter to have default name (debug-spfx-solution in this case) or type in any other name for your solution.
- Selected choice: Hit enter
- Target for component: Here we can select the target environment where we are planning to deploy the client webpart i.e. SharePoint Online or SharePoint OnPremise (SharePoint 2016 onwards).
- Selected choice: SharePoint Online only (latest)
- Place of files: We may choose to use the same folder or create a subfolder for our solution.
- Selected choice: Same folder
- Deployment option: Selecting Y will allow the app to deployed instantly to all sites and will be accessible everywhere.
- Selected choice: N (install on each site explicitly)
- Type of client-side component to create: We can choose to create client side webpart or an extension. Choose webpart option.
- Selected choice: WebPart
- Web part name: Hit enter to select the default name or type in any other name.
- Selected choice: DebugSPFx
- Web part description: Hit enter to select the default description or type in any other value.
- Selected choice: Debugging SPFx solutions
- Framework to use: Select any JavaScript framework to develop the component. Available choices are (No JavaScript Framework, React, and Knockout)
- Selected choice: React
- Solution Name: Hit enter to have default name (debug-spfx-solution in this case) or type in any other name for your solution.
- Yeoman generator will perform scaffolding process to generate the solution. The scaffolding process will take significant amount of time.
-
Once the scaffolding process is completed, lock down the version of project dependencies by running below command.
npm shrinkwrap -
On the command prompt type below command to open the solution in code editor of your choice.
code .
Run the SPFx WebPart
- On the command prompt, type
gulp serve. - Open SharePoint site
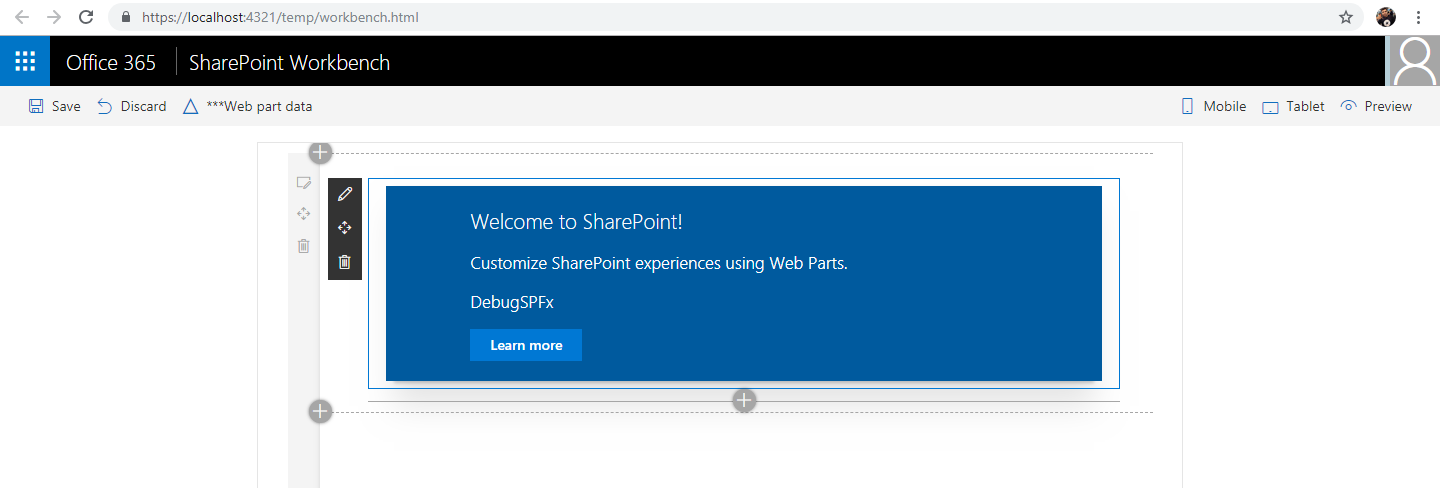
- Navigate to /_layouts/15/workbench.aspx
-
Add the webpart to page
Debugging from Browser
SharePoint Framework is purely developed using HTML and JavaScript code. The first thought comes to mind is open the developer tool of browser and debug the JavaScript code.
Let us hit F12 to open the developer tool and watch the console.
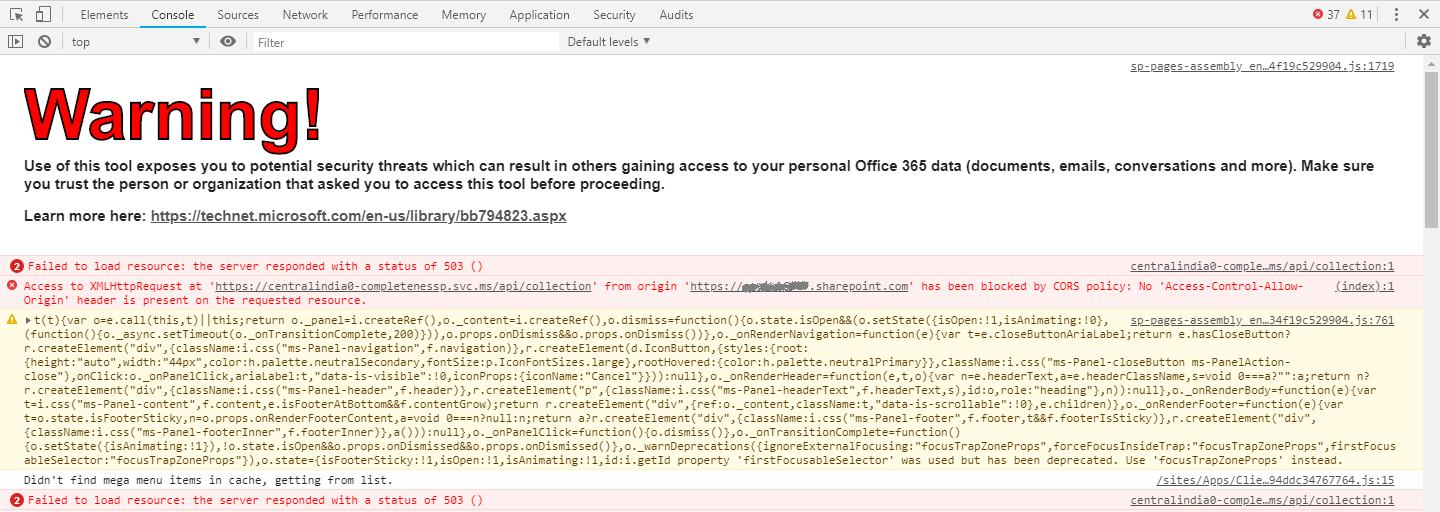
Well, the console is full of log. There are few errors but those are not generated from our code but from workbench itself.
Also note that production bundles for SharePoint Framework solutions are minimized. Debugging the minimized code is never easy to point out the exact error.
Google chrome has got the capability to transform this ugly code.
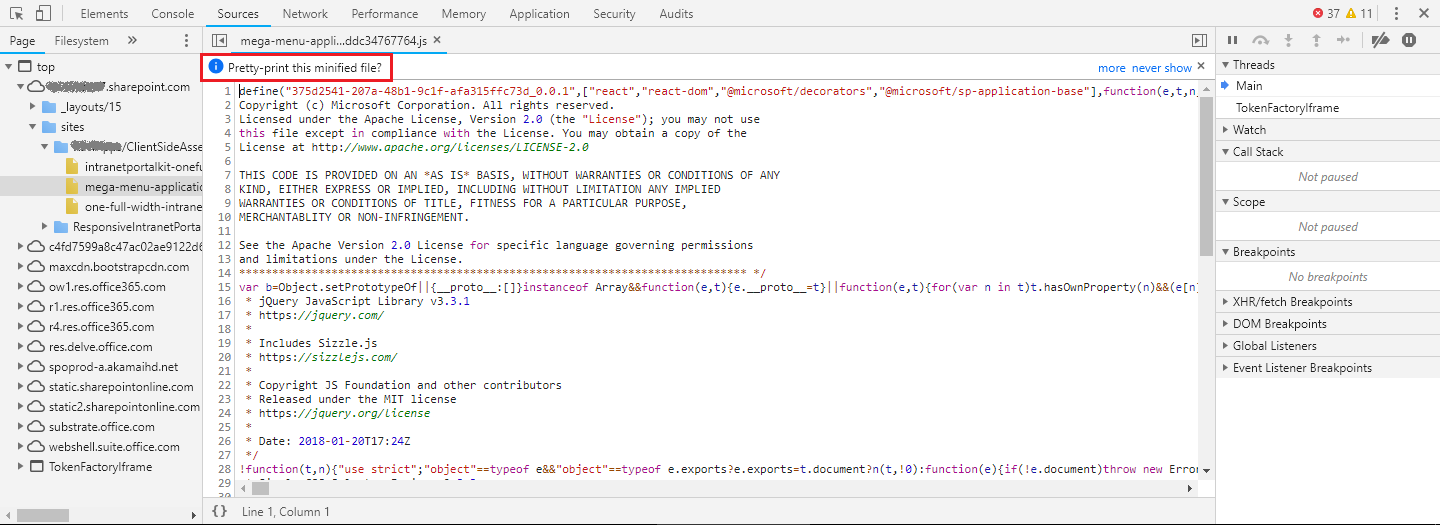
Click Pretty-print this minified file? and it will transform the minimized ugly code in to pretty code.
Debug the solution while developing
In usual cases, we want to debug our written code and not the minimized and bundled code.
-
On the command prompt, type below command:
gulp serve --nobrowser -
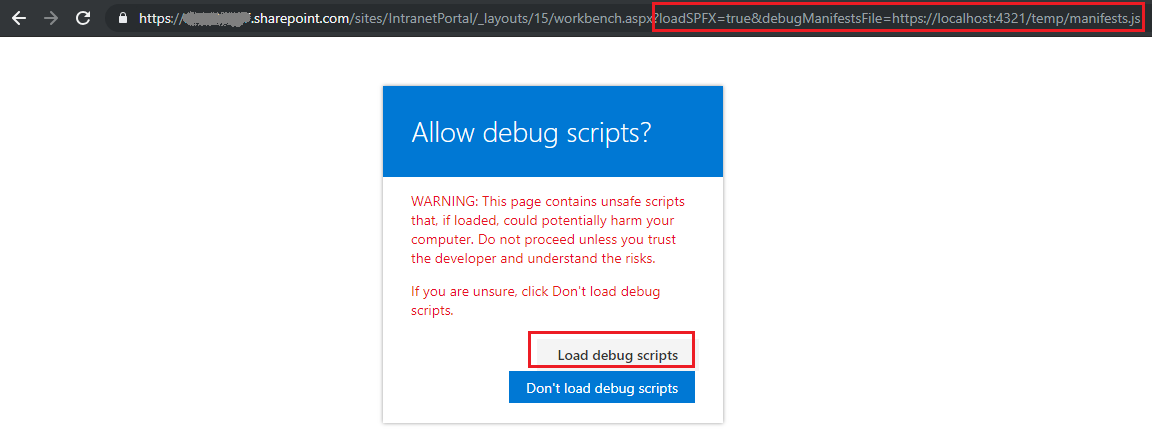
Append below to the url:
?loadSPFX=true&debugManifestsFile=https://localhost:4321/temp/manifests.js -
Click Load debug scripts.
-
From the Sources tab, open your code file and start debugging by setting up the debug points
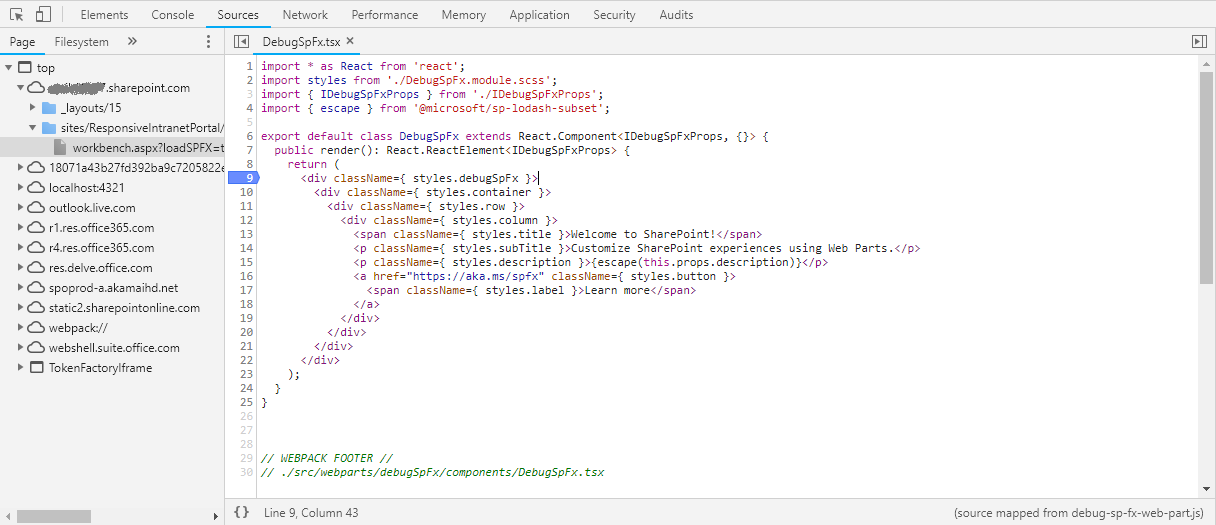
By this way, we are loading the webpart to debug in our local instance of browser. This will not stop the work of any other developer due to enabled debug points as in server side object model days.
Summary
Debugging is essential to detect and resolve the issues. As SharePoint framework client web parts are developed using JavaScript, they can be easily debugged in browser. loadSPFx and debugManifestFile query string parameters can be used to debug the code while development.
This content was originally posted here.


Leave a comment