
Debug SharePoint Framework Solutions with Visual Studio Code
Overview
Debugging is an integral part of software developer’s life. It helps to analyze the code scenarios during run time. In the previous article, we explored debugging SPFx solutions from browser.
In this article, we will explore how we can debug the SPFx solutions with Visual Studio code.
Create SPFx Solution
-
Open command prompt. Create a directory for SPFx solution.
md spfx-debug-vscode -
Navigate to above created directory.
cd spfx-debug-vscode -
Run Yeoman SharePoint Generator to create the solution.
yo @microsoft/sharepoint -
Yeoman generator will present you with the wizard by asking questions about the solution to be created.
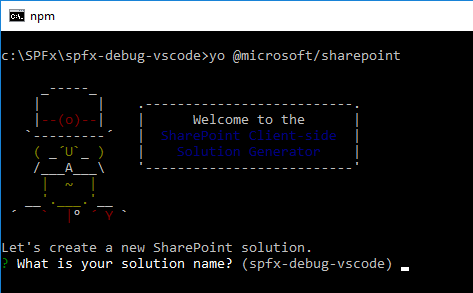
- Solution Name: Hit enter to have default name (spfx-debug-vscode in this case) or type in any other name for your solution.
- Selected choice: Hit enter
- Target for component: Here we can select the target environment where we are planning to deploy the client webpart i.e. SharePoint Online or SharePoint OnPremise (SharePoint 2016 onwards).
- Selected choice: SharePoint Online only (latest)
- Place of files: We may choose to use the current folder or create a subfolder for our solution.
- Selected choice: Use the current folder
- Deployment option: Selecting Y will allow the app to deployed instantly to all sites and will be accessible everywhere.
- Selected choice: Y
- Permissions to access web APIs: Choose if the components in the solution require permissions to access web APIs that are unique and not shared with other components in the tenant.
- Selected choice: N (solution contains unique permissions)
- Type of client-side component to create: We can choose to create client side webpart or an extension. Choose webpart option.
- Selected choice: WebPart
- Web part name: Hit enter to select the default name or type in any other name.
- Selected choice: SPFxDebug
- Web part description: Hit enter to select the default description or type in any other value.
- Selected choice: Debug SPFx with VS Code
- Framework to use: Select any JavaScript framework to develop the component. Available choices are (No JavaScript Framework, React, and Knockout)
- Selected choice: No JavaScript Framework
- Solution Name: Hit enter to have default name (spfx-debug-vscode in this case) or type in any other name for your solution.
- Yeoman generator will perform scaffolding process to generate the solution. The scaffolding process will take significant amount of time.
-
Once the scaffolding process is completed, lock down the version of project dependencies by running below command.
npm shrinkwrap -
On the command prompt type below command to open the solution in code editor of your choice.
code .
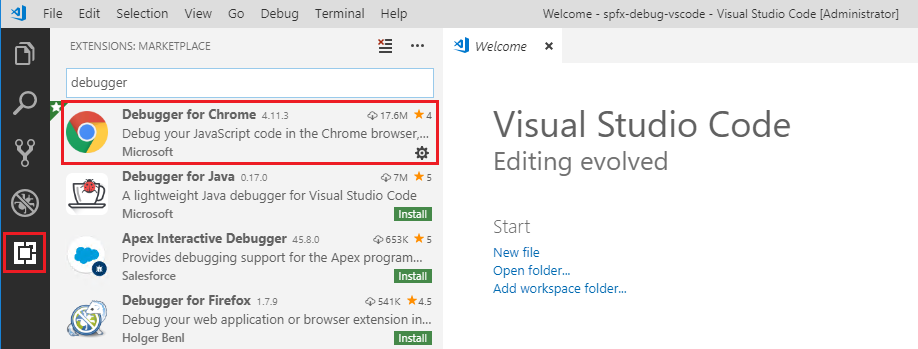
Get the Debugger Extension
- In Visual studio code, click Extensions from the left menu.
-
Search for debugger.
- Select and install Debugger for Chrome, if not installed already.
-
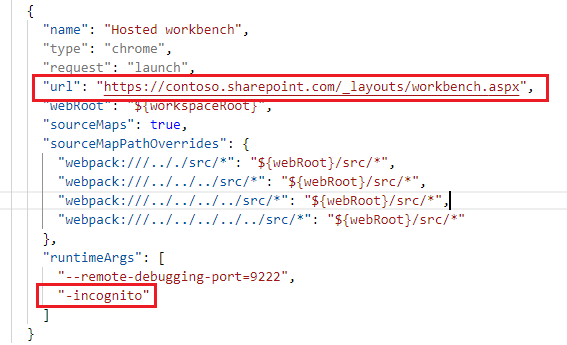
Open launch.json under .vscode folder. This file contains configurations for local workbench and hosted workbench.
 {
   /**
   * Install Chrome Debugger Extension for Visual Studio Code to debug your components with the
   * Chrome browser: https://aka.ms/spfx-debugger-extensions
   */
   "version": "0.2.0",
   "configurations": [{
       "name": "Local workbench",
       "type": "chrome",
       "request": "launch",
       "url": "https://localhost:4321/temp/workbench.html",
       "webRoot": "${workspaceRoot}",
       "sourceMaps": true,
       "sourceMapPathOverrides": {
         "webpack:///.././src/*": "${webRoot}/src/*",
         "webpack:///../../../src/*": "${webRoot}/src/*",
         "webpack:///../../../../src/*": "${webRoot}/src/*",
         "webpack:///../../../../../src/*": "${webRoot}/src/*"
       },
       "runtimeArgs": [
         "--remote-debugging-port=9222"
       ]
     },
     {
       "name": "Hosted workbench",
       "type": "chrome",
       "request": "launch",
       "url": "https://enter-your-SharePoint-site/_layouts/workbench.aspx",
       "webRoot": "${workspaceRoot}",
       "sourceMaps": true,
       "sourceMapPathOverrides": {
         "webpack:///.././src/*": "${webRoot}/src/*",
         "webpack:///../../../src/*": "${webRoot}/src/*",
         "webpack:///../../../../src/*": "${webRoot}/src/*",
         "webpack:///../../../../../src/*": "${webRoot}/src/*"
       },
       "runtimeArgs": [
         "--remote-debugging-port=9222",
         "-incognito"
       ]
     }
   ]
 }
Debugging on Local Workbench
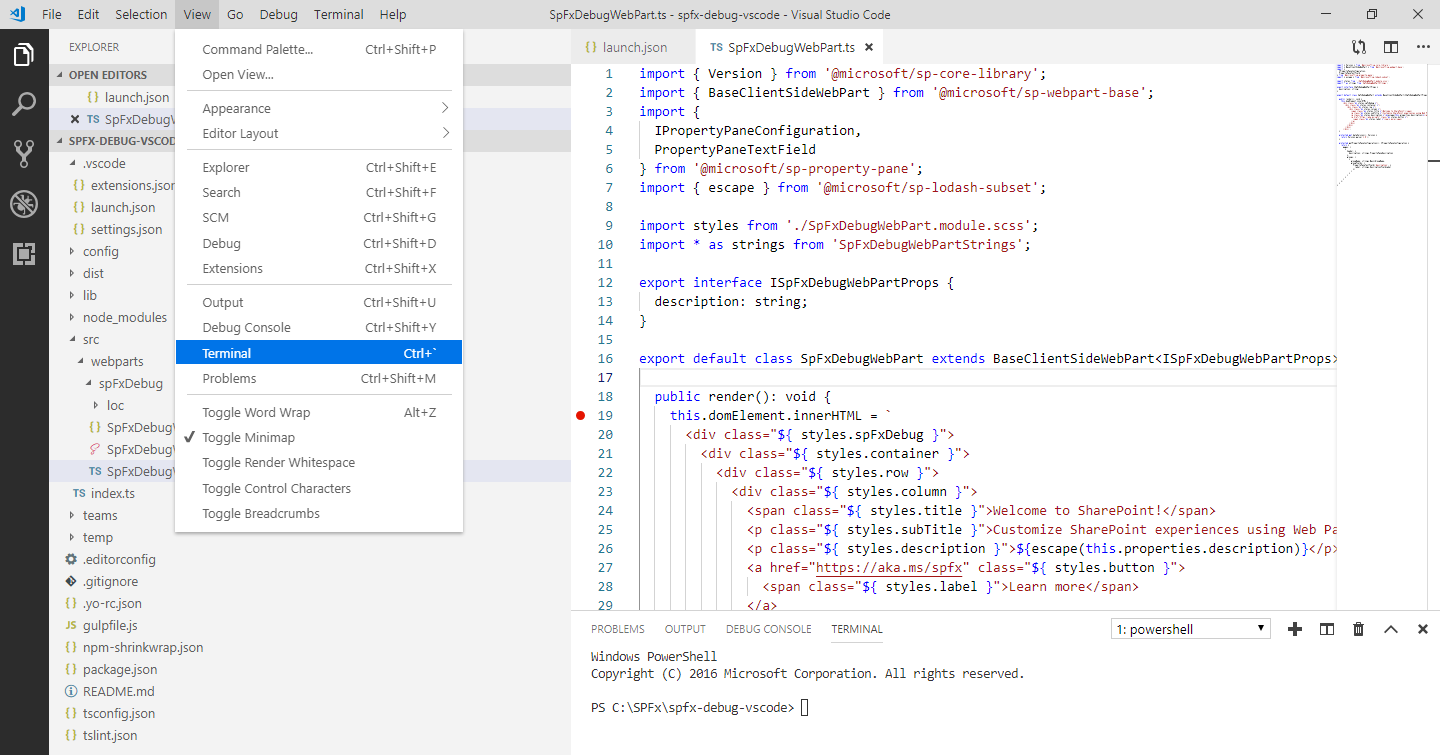
- Open the main webpart file (src\webparts\spFxDebug\SpFxDebugWebPart.ts) and set debug point to render method.
-
Click View > Terminal to open the terminal window.
-
On the terminal window type below command.
gulp serve --nobrowserNow that we are ready to debug our code in VS Code. Use any of below option to start debugging.
- On keyboard press F5.
- From main menu, click Debug > Start Debugging.
-
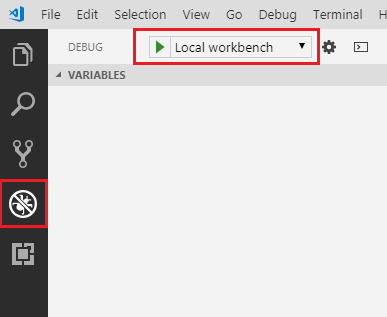
From left menu, click Debug and start debugging by clicking green arrow.
Debugging on Hosted Workbench
Follow below steps to debug on real SharePoint site.
- From VS Code open launch.json under .vscode folder.
- In the Hosted workbench configuration, type your SharePoint online site address for url property.
-
Optionally remove -incognito from runtimeArgs.
-
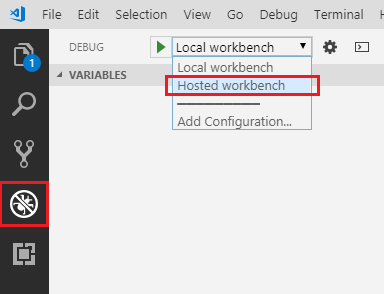
From debug menu, select Hosted workbench.
Summary
SPFx solutions can be easily debugged in VS Code using debugger extensions. This gives an comfort of developing, testing and debugging the SPFx solution from same IDE.
This content was originally posted here.


Leave a comment